
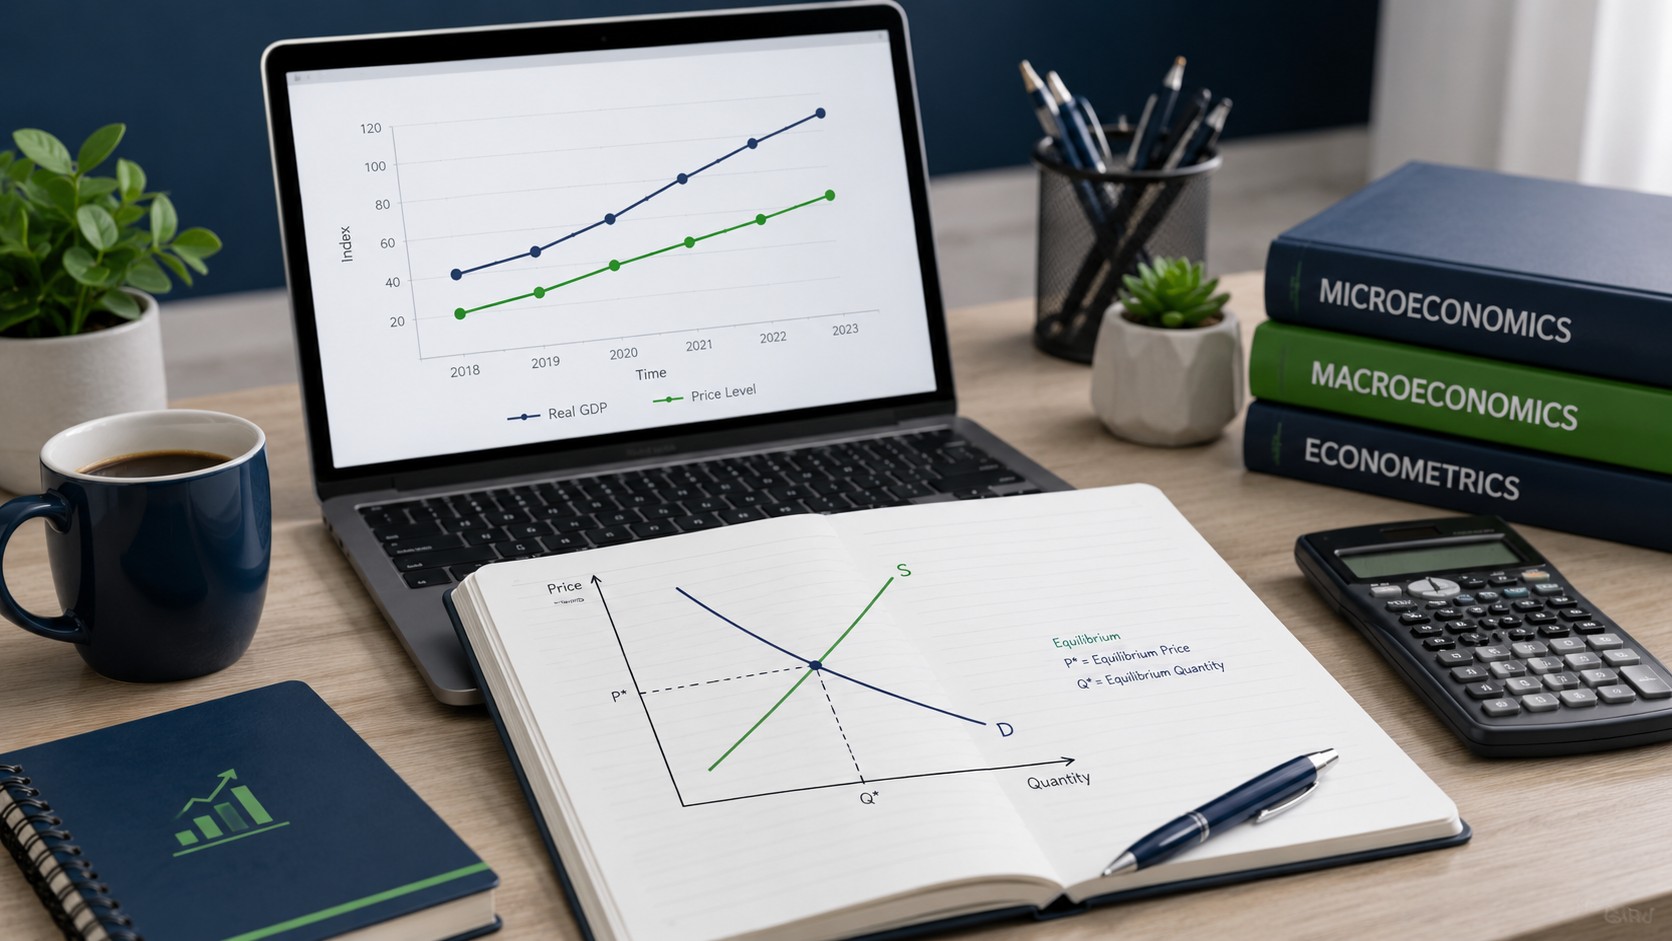
Economics Homework Help With Graphs and Answers
Economics homework help with graphs and answers is what most students really need, because the subject blends careful diagrams with step-by-step math. This guide shows you how to read and draw the core graphs, work through common problems, and check every answer so you understand it, not just copy it.
Whether you are stuck on a shifting supply curve, an elasticity calculation, or an aggregate demand model, the aim here is clarity. You will find plain-language explanations, worked examples, and a clear picture of when it makes sense to bring in expert support from EasyAssignments.
Why Economics Homework Feels Harder Than It Looks
Economics has a reputation for being deceptively tricky. On the surface, the ideas sound like common sense: prices rise when things are scarce, people buy less when goods get expensive, businesses chase profit. Yet the moment you sit down with an assignment, the common sense has to be translated into precise graphs and exact numbers, and that is where many students lose their footing.
The core difficulty is that economics uses three languages at once. There is the verbal language of intuition and real-world examples, the visual language of graphs and curves, and the mathematical language of equations and calculations. A single homework question can force you to move between all three in a matter of minutes. You might read a scenario, translate it into a diagram, shift a curve, and then compute a new equilibrium price. If any one of those steps is shaky, the whole answer falls apart.
Good economics homework help with graphs and answers works precisely because it keeps these three languages connected. Instead of memorizing a diagram in isolation, you learn to see why the curve is shaped the way it is, what a shift represents in the real world, and how the numbers underneath confirm the picture. That is the difference between a grade you earn and a grade you understand.
Key idea: A correct economics answer usually has three matching parts, the explanation in words, the graph with correct labels, and the calculation. When all three agree, you can trust your answer. When they disagree, you have found your mistake.
The Core Graphs You Must Master
Most introductory and intermediate economics courses rest on a small family of graphs. If you can draw and interpret these confidently, you can handle a surprisingly large share of any homework set. Below are the diagrams that appear again and again, along with what each one is really telling you.
Supply and Demand
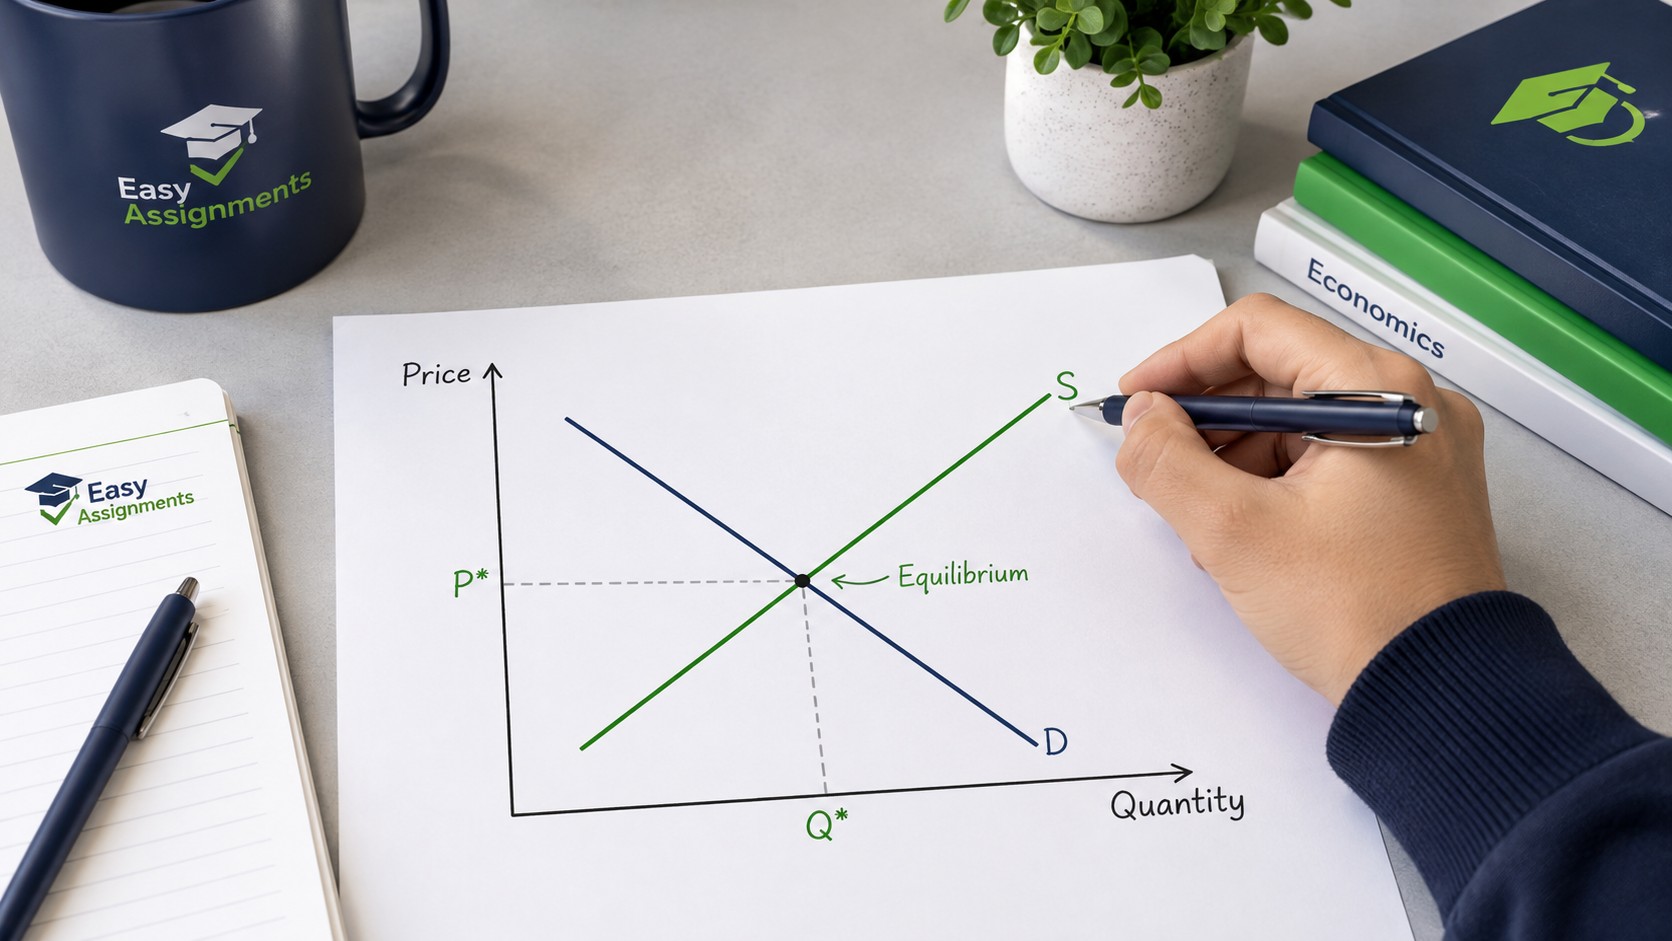
The supply and demand diagram is the backbone of microeconomics. Price sits on the vertical axis and quantity on the horizontal axis. The demand curve slopes downward because buyers want more at lower prices, and the supply curve slopes upward because sellers offer more at higher prices. Where the two curves cross is the equilibrium, the single price and quantity at which the amount buyers want to purchase equals the amount sellers want to sell.
The most common homework mistake here is confusing a shift of a curve with a movement along it. A change in the good's own price causes a movement along the curve. A change in anything else, such as income, tastes, input costs, or the price of related goods, shifts the entire curve. Getting this distinction right is often worth most of the marks on a question.
Elasticity
Elasticity measures how responsive one variable is to a change in another. Price elasticity of demand, the most common version, tells you how much quantity demanded changes when price changes. A steep demand curve is relatively inelastic, meaning quantity barely responds to price. A flat demand curve is relatively elastic, meaning quantity responds strongly. Elasticity questions usually combine a graph with a formula, so both parts need to agree.
Cost Curves and the Firm
In the theory of the firm, you meet a cluster of curves: marginal cost, average total cost, average variable cost, and marginal revenue. The signature feature is that the marginal cost curve cuts through the lowest point of the average total cost curve. Firms maximize profit where marginal cost equals marginal revenue. These diagrams look intimidating, but they follow strict logical rules, so once you learn the rules, the shapes almost draw themselves.
Aggregate Demand and Aggregate Supply
Macroeconomics scales the same thinking up to the whole economy. Aggregate demand and aggregate supply plot the overall price level against real output, or real GDP. Shifts in these curves represent recessions, booms, inflation, and the effects of government policy. The logic mirrors microeconomic supply and demand, which is why mastering the small picture first makes the big picture far easier.
How to Read and Draw a Graph the Right Way
A large portion of lost marks in economics comes not from wrong reasoning but from sloppy diagrams. Examiners and instructors reward precision, so treating your graph like a careful piece of communication pays off immediately. Follow a consistent routine every time you draw one.
- Label both axes clearly, including units where relevant, so price and quantity are never ambiguous.
- Name every curve, for example D, S, MC, or ATC, rather than leaving anonymous lines.
- Mark the equilibrium point and drop dashed lines to the axes to show the exact price and quantity.
- When a curve shifts, draw the new curve, give it a new label such as D2, and use an arrow to show the direction of the shift.
- Keep the diagram large enough to read, because a cramped graph hides the very detail you are trying to show.
Reading a graph is the same routine in reverse. Start by identifying the axes, then the curves, then the point of interest. Ask what would happen if one variable changed, and trace the effect through the diagram before you write anything. This habit alone prevents most careless errors and gives you a clear structure to explain in words.
Watch out: Never copy a graph without understanding the story behind it. If you cannot explain in one sentence why a curve slopes the way it does or why it shifted, you are likely to slip up the moment the question changes slightly.
Working Through Answers Step by Step
Answers in economics are most convincing when they show your reasoning, not just a final number. Instructors often award marks for method, so a well-structured working can rescue a question even when the final figure is slightly off. Use a repeatable four-step approach for almost any problem.
First, restate what the question is actually asking, in your own words, so you are certain of the goal. Second, identify the relevant model or formula, whether that is a demand equation, an elasticity ratio, or a profit-maximizing condition. Third, carry out the calculation carefully, writing each line so a marker can follow it. Fourth, interpret the result: say what the number means in economic terms rather than leaving it bare.
A Simple Elasticity Example
Suppose the price of a coffee rises from 2 to 3 units and the quantity demanded falls from 100 to 80 cups. To find price elasticity of demand, you compare the percentage change in quantity with the percentage change in price. Quantity falls by 20 percent while price rises by 50 percent, so the elasticity is roughly 0.4 in size. Because that value is below 1, demand is inelastic, meaning buyers are not very sensitive to this price change. Notice how the answer ends with meaning, not just a number, which is exactly what earns full marks.
An Equilibrium Example
If demand is given by an equation and supply by another, equilibrium is found by setting the two equal and solving for price. Once you have the equilibrium price, substitute it back into either equation to find the quantity. Then, to complete a strong answer, sketch the diagram and confirm that the calculated point matches where your curves cross. When the graph and the math agree, you have a reliable answer you can defend.
Stuck On A Tricky Graph Or Calculation?
You do not have to untangle shifting curves and awkward formulas alone. Send us the question and get a clear, worked solution with the graph explained.
Microeconomics vs Macroeconomics: What to Expect
Economics homework usually falls into one of two branches, and knowing which one you are in tells you which tools to reach for. Microeconomics studies individual decision makers, such as households and firms, and the specific markets they operate in. Macroeconomics zooms out to study the whole economy, including growth, unemployment, inflation, and government policy. The table below summarizes the typical differences you will meet in assignments.
| Feature | Microeconomics | Macroeconomics |
|---|---|---|
| Focus | Individual markets, firms, and consumers | The whole economy and national aggregates |
| Core graphs | Supply and demand, cost curves, elasticity | Aggregate demand and supply, business cycles |
| Typical questions | Find equilibrium, calculate elasticity, firm profit | Analyze policy, inflation, unemployment, GDP |
| Key measures | Price, quantity, cost, revenue | GDP, price level, interest rate, output gap |
| Common difficulty | Shift vs movement, reading cost diagrams | Linking policy to curve shifts and outcomes |
Many students find microeconomics more intuitive at first because it deals with familiar decisions like buying and selling. Macroeconomics can feel more abstract, since the actors are entire economies and the effects unfold over time. The reassuring point is that the underlying graph logic is shared, so effort spent mastering micro diagrams pays dividends when macro arrives.
Common Mistakes and How to Avoid Them
Certain errors show up in economics homework so often that recognizing them in advance is one of the fastest ways to raise your grade. Being aware of these traps helps you slow down at exactly the moments where marks are usually lost.
Confusing shifts and movements
A change in the good's own price moves you along a curve. Any other change shifts the whole curve. Mixing these up is the single most common error in supply and demand questions.
Forgetting to label
Unlabelled axes and anonymous curves cost easy marks. A diagram that is not labelled cannot fully communicate your reasoning, no matter how correct your thinking is.
Skipping interpretation
Ending an answer with a bare number leaves marks on the table. Always state what the result means in economic terms so the reasoning is complete.
Ignoring assumptions
Economic models rest on assumptions such as all else being equal. Forgetting them leads to answers that contradict the model you were asked to use.

Study Strategies That Actually Build Understanding
The students who thrive in economics rarely rely on last-minute cramming. Instead, they build understanding gradually with a few reliable habits. These strategies help you retain the material and, just as importantly, apply it under exam conditions when the questions look unfamiliar.
Practice drawing graphs from a blank page rather than only recognizing finished ones. Being able to reproduce a diagram from memory forces you to understand its logic. Talk through problems aloud or explain them to a classmate, because teaching a concept quickly reveals the gaps in your own grasp. Connect each model to a real-world example, since a curve is far easier to remember when it is attached to a story about actual prices or policies.
It also helps to work backward from past assignments. Look at the kinds of questions your course tends to ask, group them by the model they use, and practice several of each. Over time you will start to recognize a question's type within seconds, which frees your energy for the reasoning that earns marks. If you keep hitting the same wall, that is a strong signal to seek focused help rather than repeating the same confusion.
Tip: Keep a personal error log. Each time you get a question wrong, write one line on what went wrong and one line on the fix. Reviewing this list before an exam is one of the most efficient ways to improve.
When to Get Expert Economics Homework Help
Seeking help is not a shortcut around learning, it is a way to learn faster when you are genuinely stuck. There is a real difference between struggling productively, where you are making slow progress, and struggling unproductively, where you are stuck on the same step with no new insight. The second situation is exactly when quality economics homework help with graphs and answers is worth its weight.
Good support does more than hand over a final figure. It shows the full working, explains why each step follows from the last, and draws the graph so you can see how the diagram and the numbers fit together. The goal is that next time a similar question appears, you can handle it yourself. That is why working with a service like EasyAssignments is framed around explanation and clarity rather than simply supplying answers to copy.
- You have tried the question, checked your notes, and still cannot see the next step.
- A deadline is close and you need a clearly worked model answer to learn from.
- You understand the words but the graph or the calculation keeps tripping you up.
- You want a second set of eyes to confirm that your reasoning and diagram actually match.
Whenever any of these describe your situation, reaching out early is far better than handing in something you know is shaky. You can get a free quote or talk to support and describe exactly where you are stuck.
Frequently Asked Questions
Can I get economics homework help with graphs and answers explained, not just given?
Yes. The most useful help walks you through the full working and draws the graph with labels so you understand the reasoning. A worked model answer lets you follow each step and apply the same method to the next similar question on your own.
What is the difference between a shift and a movement on a graph?
A movement along a curve happens when the good's own price changes. A shift of the entire curve happens when something else changes, such as income, tastes, input costs, or the price of related goods. Confusing the two is the most common error in supply and demand questions.
Do I need to be good at math to succeed in economics?
Introductory economics mostly uses percentages, basic algebra, and simple graph reading, so you do not need advanced math. Higher level courses add more equations, but a steady, step-by-step approach and clear working matter far more than raw math speed.
How do I check whether my economics answer is correct?
Cross-check the three parts of your answer: the explanation in words, the graph, and the calculation. If all three agree, the answer is reliable. If they disagree, you have located your mistake and can fix the step that does not fit.
Turn Confusing Graphs Into Confident Answers
Get clear, step-by-step economics homework help with graphs and answers explained the right way. Reach out today and move from stuck to sure.