
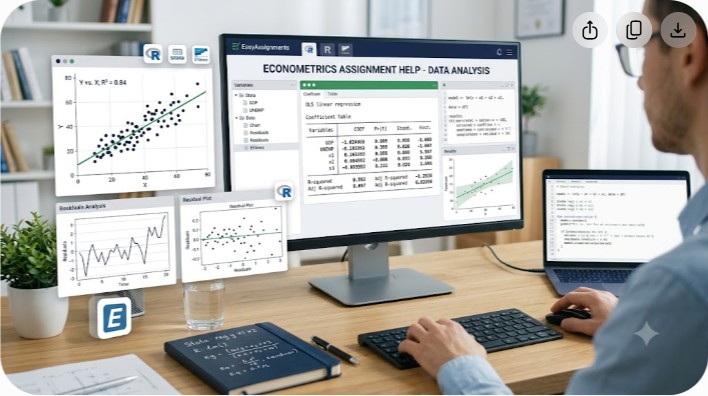
Econometrics Assignment Help With Stata, R, and EViews
Econometrics assignments combine statistics, economic theory, and software into one demanding task. If regressions, hypothesis tests, or panel data models are slowing you down, expert econometrics assignment help across Stata, R, and EViews can turn a confusing dataset into a clear, defensible analysis.
This guide explains what each tool does best, how to interpret common outputs, and the mistakes that quietly cost marks. Whether you are running your first ordinary least squares model or wrestling with cointegration, you will find practical direction here.
Why Econometrics Assignments Feel So Hard
Econometrics sits at an awkward intersection. It asks you to understand economic theory, master a good chunk of statistics and probability, and then translate all of that into working software code. Many students are comfortable with one of these three skills but rarely all of them at once. When a professor sets a task that says "estimate a wage equation and test for heteroskedasticity," you need to know the economics behind wages, the statistical meaning of heteroskedasticity, and the exact commands that produce and diagnose the model.
The tools add another layer of difficulty. Stata, R, and EViews each have their own syntax, quirks, and default behaviors. A model that takes one line in Stata might take a small block of code in R, and the output can look completely different even when the underlying math is identical. Getting econometrics assignment help means getting support on all three fronts at once: the theory, the statistics, and the software.
There is also the interpretation problem. Running a regression is often the easy part. The real challenge, and where most marks are won or lost, is reading the output correctly. A coefficient is not just a number. It carries a sign, a magnitude, a unit, a level of statistical significance, and an economic story. Confusing statistical significance with economic importance, or forgetting that correlation is not causation, are the kinds of slips that turn a technically correct model into a weak assignment.
Choosing Between Stata, R, and EViews
One of the first questions students ask is which software they should use. Often the choice is made for you by your course or your instructor, but understanding the strengths of each helps you work faster and interpret results with confidence. Each program can handle the core econometric methods, so the differences come down to workflow, cost, and the specific field you are working in.
Stata: the applied economics workhorse
Stata is enormously popular in applied economics, public policy, epidemiology, and the social sciences. Its main appeal is a clean, readable command syntax where a single line often does a lot of work. Estimating a regression with robust standard errors, for example, is compact and intuitive. Stata also has excellent documentation, a strong panel data toolkit, and post-estimation commands that make diagnostics and predictions straightforward.
For students, Stata's biggest advantage is the balance between power and simplicity. You can write clean do-files that document every step of your analysis, which is exactly what markers want to see. The trade-off is that Stata is commercial software, so access usually depends on a university license.
R: free, flexible, and infinitely extensible
R is free, open source, and backed by thousands of contributed packages. For econometrics, libraries such as those for linear models, panel data, instrumental variables, and time series give you access to nearly any method you might need. R also produces publication-quality graphics and integrates smoothly with report writing, which is a real advantage for longer projects and dissertations.
The cost of that flexibility is a steeper learning curve. R expects you to think a little more like a programmer, managing objects, data frames, and functions. Error messages can be cryptic for beginners, and there are often several ways to do the same task. Once you are comfortable, though, R is arguably the most versatile of the three tools.
EViews: built for time series and forecasting
EViews was designed with time series analysis and forecasting in mind, which is why it is a favorite in finance and macroeconomics courses. Its point-and-click interface is friendly for newcomers, and tasks like unit root tests, autoregressive models, vector autoregressions, and cointegration analysis are well supported and easy to reach through menus. If your assignment is heavy on time series concepts, EViews often feels the most natural.
The interface that helps beginners can also become a limitation for advanced or highly customized work, where a scripting language like R offers more control. Like Stata, EViews is commercial software, so licensing matters.
Quick rule of thumb: reach for Stata for applied microeconomics and panel data, R for flexible or graphics-heavy projects, and EViews for time series and forecasting. If your course specifies a tool, use that one and learn it well.
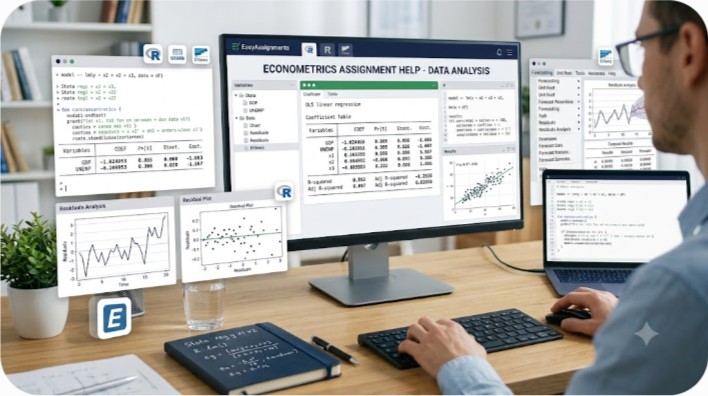
Software Comparison at a Glance
The table below summarizes how the three programs stack up on the features that matter most for coursework. Use it to decide where to focus your energy if the choice is yours, or to understand the tool your course has assigned.
| Feature | Stata | R | EViews |
|---|---|---|---|
| Cost | Commercial license | Free and open source | Commercial license |
| Learning curve | Moderate | Steeper | Gentle (menu driven) |
| Best for | Applied micro, panel data | Flexible modeling, graphics | Time series, forecasting |
| Interface | Command and menu | Script based | Point and click |
| Reproducibility | Strong (do-files) | Strong (scripts) | Good (programs) |
| Graphics | Good | Excellent | Good |
Core Econometric Methods You Will Encounter
Most econometrics assignments draw from a common set of methods. Recognizing which technique a question calls for is half the battle. Below are the models that show up most often, along with what they are used for.
Ordinary least squares regression
OLS is the foundation of the whole subject. It estimates a linear relationship between a dependent variable and one or more explanatory variables by minimizing the sum of squared residuals. Nearly every course begins here, and most advanced methods are extensions or fixes for situations where the classical OLS assumptions break down. Understanding what OLS does, and the assumptions it relies on, is essential before moving further.
Panel data models
When you have data on many units, such as firms, countries, or individuals, observed over several time periods, panel data methods let you exploit both the cross-sectional and time dimensions. Fixed effects models control for unobserved characteristics that stay constant over time, while random effects models treat those individual differences as random. Choosing between them often involves a Hausman test, a classic exam and assignment topic.
Time series analysis
Time series work deals with data observed sequentially over time, where order matters and observations are often correlated with their own past. Key concepts include stationarity, unit root testing, autoregressive and moving average models, and cointegration between series that trend together. This is the territory where EViews particularly excels.
Instrumental variables and endogeneity
When an explanatory variable is correlated with the error term, OLS estimates become biased. Instrumental variables methods, including two-stage least squares, address this endogeneity by using instruments that affect the problematic variable but not the outcome directly. This is one of the harder topics conceptually, and a common source of confusion in assignments.
Limited dependent variable models
When your outcome is binary, such as whether a person is employed or not, or takes a limited range of values, standard OLS is inappropriate. Logit and probit models handle binary outcomes, while other approaches deal with counts, censored data, and ordered categories. Interpreting these models requires care because the coefficients do not translate directly into simple effects.
Stuck on a Regression or Diagnostic?
Send us the dataset and the question. You will get clean, commented code, correct output, and a plain-English explanation of what the results mean.
How to Interpret Regression Output Correctly
Producing a regression table is straightforward once you know the commands. Reading it correctly is where marks are earned. Here is how to work through the key elements that appear in almost every model, regardless of which software generated them.
- Coefficients: each one measures the estimated change in the dependent variable for a one-unit change in that explanatory variable, holding the others constant. Always report the sign, size, and units, and connect them back to economic theory.
- Standard errors: these measure the precision of each coefficient. Smaller standard errors relative to the coefficient mean a more reliable estimate.
- t-statistics and p-values: these test whether a coefficient is statistically different from zero. A low p-value suggests the variable matters statistically, but it says nothing about whether the effect is economically important.
- R-squared: this shows the share of variation in the dependent variable explained by the model. A high value is not automatically good, and a low value is not automatically bad; it depends on the context.
- F-statistic: this tests the joint significance of the explanatory variables, telling you whether the model as a whole has explanatory power.
The most valuable habit is to always translate numbers into sentences. Instead of stating that a coefficient is 0.42 and significant, write what that means in context: a one-unit rise in the explanatory variable is associated with a 0.42 unit increase in the outcome, and this relationship is statistically significant at the chosen level. That single translation step is what separates an average assignment from a strong one.
Model Diagnostics That Markers Look For
A model is only trustworthy if its underlying assumptions hold. Diagnostic testing is often where assignments allocate a surprising number of marks, so it is worth building the habit of checking your models rather than accepting the first output you see.
Heteroskedasticity
When the variance of the errors is not constant, standard errors can be misleading. Tests like Breusch-Pagan and White detect it, and robust standard errors are a common fix.
Autocorrelation
Common in time series, this occurs when errors are correlated over time. The Durbin-Watson and Breusch-Godfrey tests help you detect it before it distorts inference.
Multicollinearity
When explanatory variables are highly correlated, coefficients become unstable. Variance inflation factors are the standard way to flag it.
Normality and specification
Residual normality tests and specification checks such as the Ramsey RESET test confirm whether your model form is reasonable.
Common Mistakes That Cost Marks
Even capable students lose marks on avoidable errors. Being aware of these traps in advance is one of the fastest ways to lift your grade without learning any new theory.
- Treating statistical significance as proof of economic importance, or the reverse.
- Claiming causation from what is only a correlation, without a clear identification strategy.
- Skipping diagnostic tests and presenting a model whose assumptions may be violated.
- Misreading the units of a coefficient, especially with logged variables or interaction terms.
- Copying software output into a document without explaining what any of it means.
- Ignoring the economic theory that should motivate the model in the first place.
Academic integrity note: use assignment help to learn the methods, understand your code, and interpret your own results. Reputable support explains the analysis so you can defend it in a viva or exam, rather than handing over work you cannot explain.
How EasyAssignments Supports Your Econometrics Work
Good econometrics assignment help does more than produce an answer. It helps you understand the reasoning so the next assignment becomes easier. When you work with EasyAssignments, the goal is a piece of analysis you can read, question, and defend on your own.
Support typically covers the full workflow: cleaning and preparing your dataset, specifying an appropriate model, writing clean and commented code in Stata, R, or EViews, running the necessary diagnostics, and interpreting every result in plain language. You receive not just the output but an explanation of what the numbers mean and why the chosen method fits the question. For longer projects, that also includes structuring the write-up so your empirical results connect clearly to your research question and to relevant economic theory.
The emphasis throughout is on clarity and correctness. Well-documented code lets you reproduce and adapt the analysis, and a clear explanation means you are never presenting results you do not understand. If you want to get started or ask a specific question, you can request a free quote or talk to our support team at any time.
Frequently Asked Questions
Which software is best for my econometrics assignment?
If your course specifies a tool, use that one. Otherwise, Stata suits applied microeconomics and panel data, R offers the most flexibility and the best graphics, and EViews is excellent for time series and forecasting. Econometrics assignment help can be provided in whichever of the three your task requires.
Can I get help interpreting results I already have?
Yes. Interpretation is often the hardest part. If you already have regression output but are unsure what the coefficients, p-values, or diagnostic tests mean, support can walk you through reading and writing up the results correctly in context.
Will the code be explained or just delivered?
Quality help includes clean, commented code alongside a plain-English explanation of each step. The aim is for you to understand and reproduce the analysis yourself, not to receive a black box you cannot defend.
What topics can be covered?
Support spans the full range of standard methods, including ordinary least squares, panel data with fixed and random effects, time series and cointegration, instrumental variables, and limited dependent variable models such as logit and probit, along with the diagnostic tests that go with them.
Turn a Confusing Dataset Into a Clear Analysis
Get econometrics assignment help in Stata, R, or EViews with code you can read and results you can defend.