
Write My Chemistry Lab Report With Data Analysis the Right Way
A chemistry lab report with data analysis is more than a write-up of what happened at the bench. It is a structured argument that connects your raw measurements to a scientific conclusion, backed by calculations, graphs, and honest error analysis.
This guide walks through every section a marker expects, shows you how to turn messy numbers into clean results, and points out the mistakes that quietly cost grades. Whether you are writing a titration report or a kinetics study, the same principles apply.
Why a Chemistry Lab Report With Data Analysis Matters
Ask any chemistry instructor what separates a top lab report from an average one, and the answer is rarely the experiment itself. Two students can run the identical procedure, record similar numbers, and still receive very different grades. The gap almost always comes down to a chemistry lab report with data analysis that actually interprets the results rather than simply listing them. A report is a piece of scientific communication. It must convince a reader who was not in the room that your method was sound, your measurements were careful, and your conclusion follows from the evidence.
Data analysis is the engine that drives that argument. Raw readings, such as burette volumes, masses on a balance, temperature curves, or absorbance values, mean nothing on their own. They become meaningful only when you process them: averaging repeated trials, applying the right formula, propagating uncertainty, plotting a trend, and comparing your outcome against a theoretical or literature value. When you learn to do this well, the writing becomes easier because the story is already there in the numbers. When you skip it, even a beautifully formatted report reads as hollow.
There is also a practical reason to take analysis seriously. In most university marking schemes, the analysis and discussion sections carry the largest share of the marks. Presentation and neatness matter, but they are not where the grade is won or lost. If you can show that you understand what your data means, why it deviates from the ideal, and what that implies about the chemistry, you signal genuine scientific competence. That is exactly what examiners are trained to reward.
Key idea: A lab report is judged less on getting the "right" answer and more on how rigorously you analyse and explain the answer you actually got. Honest analysis of imperfect data beats a suspiciously perfect result with no interpretation.
The Standard Structure of a Chemistry Lab Report
Almost every chemistry lab report follows a recognised skeleton. Your department may tweak the labels or ask you to merge a couple of sections, but the underlying logic is consistent across schools and levels. Understanding the purpose of each part helps you know what belongs where, which prevents the common problem of dumping everything into the discussion because you were not sure where it should go.
Title, Abstract, and Introduction
The title should be specific and descriptive. "Determination of the Concentration of Acetic Acid in Vinegar by Acid-Base Titration" tells the reader far more than "Titration Experiment." The abstract is a compact summary of the whole report, usually 150 to 250 words, written last even though it appears first. It states the aim, the method in one line, the key numerical result with its uncertainty, and the main conclusion. A reader should be able to understand your entire study from the abstract alone.
The introduction sets the scientific context. It explains the theory behind the experiment, defines any relevant equations, and states a clear aim and, where appropriate, a hypothesis. This is where you show you understand why the experiment works, not just how to perform it. Cite the underlying principles: for a titration, that means the stoichiometry of the neutralisation reaction; for a kinetics study, the rate law you expect to observe.
Materials, Method, and Results
The materials and method describe what you did in enough detail that a competent peer could reproduce your work. Write in the past tense and, in most academic styles, the passive voice. Avoid turning it into a numbered recipe copied from the manual; instead, describe your actual procedure, including any deviations. If you diluted a sample or repeated a trial because the first was anomalous, say so here.
The results section presents your data, and this is where good organisation pays off. Raw data goes into clearly labelled tables with correct units and appropriate significant figures. Processed results, such as averages and calculated concentrations, can sit alongside the raw values or in a separate table. Graphs belong here too. Crucially, the results section presents the data with minimal commentary; the interpretation is saved for the discussion.
Discussion, Conclusion, and References
The discussion is the heart of the report. Here you interpret what the numbers mean, compare your result to the accepted value, explain any discrepancy through error analysis, evaluate the reliability of your method, and suggest improvements. The conclusion is a short, direct restatement of what you found and whether the aim was met. References list every source you cited, formatted in the style your department requires, such as ACS, APA, or Harvard.
Turning Raw Data Into Real Analysis
This is the section students most often rush, and it is the single biggest opportunity to raise a grade. Data analysis is a sequence of deliberate steps that transforms recorded readings into interpretable results. Let us walk through them in the order you should apply them.
Step 1: Record and Tabulate Raw Data Correctly
Before any calculation, your raw data must be trustworthy. Record every measurement to the precision the instrument allows. A burette read to the nearest 0.05 mL should be written as 24.85 mL, not 24.9 mL, because you are discarding real information. Include units in the table header, not repeated in every cell. Perform repeated trials, ideally at least three concordant results, because a single reading gives you no way to judge reliability.
Step 2: Process the Data
Processing means applying the correct chemistry to your raw numbers. For a titration, that involves calculating moles of titrant, using the reaction stoichiometry to find moles of analyte, and dividing by volume to get concentration. For a gravimetric analysis, it means subtracting the mass of the empty container to isolate the mass of product. Show at least one full worked example of each calculation type. Markers want to see that you can do the arithmetic, so do not hide it inside a spreadsheet and present only the final number.
Step 3: Average and Assess Concordance
When you have several trials, average only the concordant ones, meaning those that agree within an acceptable range, typically 0.1 mL for titres. Discard clear outliers, but explain why you did so. Reporting the mean of your best trials, along with a note about which readings you excluded and why, demonstrates careful practice rather than a blind average of everything.
Step 4: Visualise With Graphs
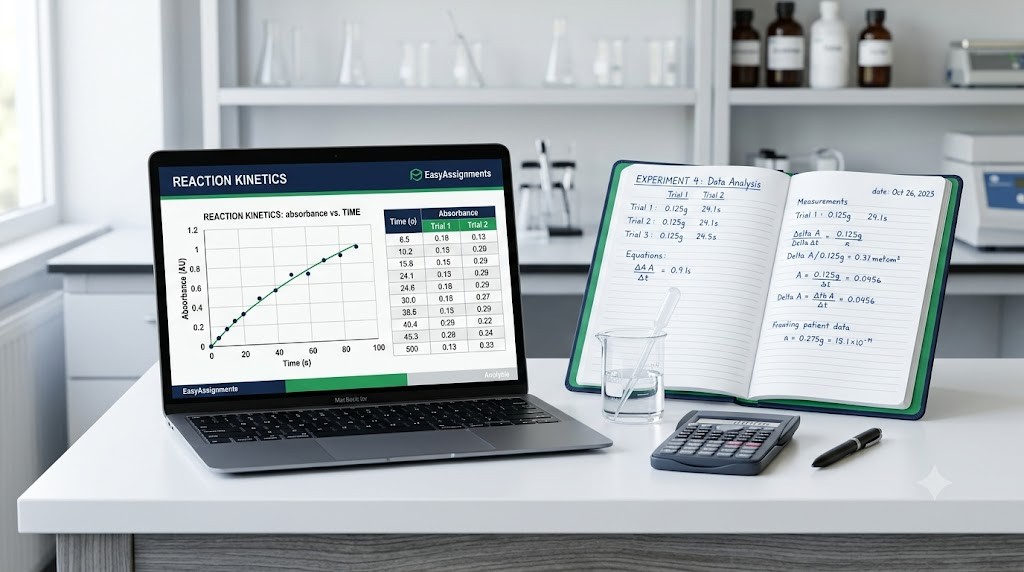
Many experiments produce data that is best understood as a trend. A rate experiment, a Beer-Lambert calibration curve, or a cooling curve all call for a graph. A strong graph has a descriptive title, labelled axes with units, sensibly chosen scales, plotted points, and a line of best fit where appropriate. From a calibration line you can read off an unknown concentration; from a gradient you can extract a rate constant or an extinction coefficient. Always state what the graph tells you, and quote the equation of any trendline you use.
Common mistake: Connecting data points dot-to-dot instead of drawing a line of best fit. Chemistry data usually follows a trend with scatter, so a straight or smooth best-fit line is almost always more appropriate than a zigzag that joins every point.
Error Analysis and Uncertainty
Error analysis is what separates a school-level report from a university-level one, and it is frequently where the most marks are available in the discussion. The goal is not to apologise for imperfect results but to quantify how imperfect they are and to identify why. Every measurement carries uncertainty, and a good report treats that uncertainty as data in its own right.
Random Versus Systematic Errors
Random errors cause scatter around the true value and can be reduced by repeating measurements and averaging. Reading a burette meniscus slightly differently each time is a random error. Systematic errors shift every reading in the same direction and cannot be reduced by repetition. An uncalibrated balance that reads consistently high, or heat loss to the surroundings in a calorimetry experiment, produces a systematic error. A strong discussion distinguishes between the two and explains which dominated in your experiment.
Calculating Percentage Error and Uncertainty
Percentage error compares your result to the accepted or theoretical value, calculated as the absolute difference divided by the accepted value, multiplied by one hundred. Percentage uncertainty, by contrast, comes from the precision of your instruments. You sum the percentage uncertainties of each measured quantity to estimate the overall uncertainty in your final result. If your percentage error is much larger than your percentage uncertainty, that gap points to a systematic error your instruments alone cannot explain, and your discussion should propose what caused it.
Pro tip: Compare your percentage error against your total percentage uncertainty. If error sits within uncertainty, your result is consistent with theory. If error greatly exceeds uncertainty, a systematic problem is likely, and naming it convincingly earns marks.
| Analysis Element | What It Shows | Weak Report | Strong Report |
|---|---|---|---|
| Raw data | Care and precision | Rounded, missing units | Full precision, clear units, repeated trials |
| Calculations | Method understanding | Only final answer shown | One full worked example per calculation type |
| Graphs | Trend interpretation | Dot-to-dot, no labels | Best-fit line, labelled axes, quoted equation |
| Error analysis | Scientific rigour | "Human error" with no detail | Random vs systematic, quantified uncertainty |
| Conclusion | Evidence-based reasoning | Vague, unsupported claim | Result with uncertainty, aim addressed directly |
Stuck on the Analysis Section?
If your data is recorded but the calculations, graphs, and error analysis are not coming together, EasyAssignments can help you structure and strengthen your chemistry lab report while keeping the work original.
Writing the Discussion That Earns the Marks
The discussion is where you prove you are a scientist and not just a technician following instructions. A strong discussion is built around a few questions, and answering each one in turn keeps your writing focused and thorough.
Start by stating what your result was and how it compares to the accepted value. Then explain the size and direction of any discrepancy using your error analysis. Was your titre consistently too high, suggesting an endpoint you overshot? Was your measured enthalpy lower than expected, consistent with heat lost to the surroundings? Link every observed deviation to a plausible physical cause rather than reaching for the empty phrase "human error," which markers see as a signal that a student stopped thinking.
Next, evaluate your method. Which step introduced the most uncertainty? Would a more precise instrument, a larger sample, or more repeats have improved reliability? Suggest specific, realistic improvements. Finally, place your findings in context: does your result confirm the underlying theory, and what would a logical next experiment be? This kind of reflective, evidence-linked writing is exactly what distinguishes a first-class report.
Words and Phrases That Strengthen Analysis
- Use "this suggests," "this is consistent with," and "this indicates" to link data to interpretation.
- Use "however," "in contrast," and "conversely" to handle results that disagree with expectation.
- Quantify wherever possible: "a percentage error of roughly four percent" is stronger than "a small error."
- Attribute deviations to named causes such as heat loss, indicator choice, or parallax, not to generic mistakes.
Common Mistakes That Cost Grades
Many lost marks come from a short list of recurring errors. Knowing them in advance lets you check your own report before you submit.
Mixing results and discussion
Presenting interpretation inside the results section, or dumping raw numbers into the discussion, blurs two sections that markers grade separately.
Ignoring significant figures
Quoting a concentration to eight decimal places implies precision your instruments never had. Match significant figures to your least precise measurement.
Blaming "human error"
This phrase without a specific, named cause tells the examiner you did not analyse your errors. Always identify the actual source.
Unlabelled graphs and tables
Missing units, titles, or axis labels make data hard to read and suggest carelessness, costing easy presentation marks.
How EasyAssignments Supports Your Lab Report
Sometimes you understand the chemistry but run out of time, or you have the data recorded and simply cannot see how to structure the analysis and discussion. That is where guided help makes a difference. EasyAssignments works with students who want their chemistry lab report with data analysis to be clear, correctly structured, and academically sound. The focus is on helping you present your own experimental data properly: organising tables, checking calculations, building graphs with the right best-fit lines, and framing an error analysis that holds up.
Good support does not replace your understanding; it reinforces it. When you see how a strong discussion is built, how uncertainty is propagated, and how a conclusion is tied back to the aim, you carry those skills into every future report. If you would like a hand, you can request a free quote or talk to the support team to explain exactly what you need.
Frequently Asked Questions
What should a chemistry lab report with data analysis include?
It should include a title, abstract, introduction with theory and aim, method, a results section with labelled tables and graphs, a discussion containing worked calculations and error analysis, a conclusion, and references. The analysis and discussion usually carry the most marks.
How do I analyse data in a chemistry lab report?
Record raw data at full precision, process it with the correct formulas showing at least one worked example, average concordant trials, plot trends with a line of best fit, and quantify uncertainty. Then interpret what the numbers mean in the discussion.
What is the difference between random and systematic errors?
Random errors cause scatter and can be reduced by repeating and averaging measurements. Systematic errors shift every reading in the same direction, such as an uncalibrated balance, and cannot be reduced by repetition. Naming which dominated strengthens your discussion.
How long should a chemistry lab report be?
Length varies by course, but most undergraduate reports run from about 1,000 to 2,500 words excluding tables and appendices. Focus on depth of analysis rather than word count, since a concise, well-argued discussion scores better than padding.
Ready to Finish Your Chemistry Lab Report?
Turn your raw data into a clear, well-structured report with proper analysis, graphs, and error discussion. EasyAssignments is here to help you get it right.