

Business Statistics Assignment Help With Hypothesis Testing
Hypothesis testing is where business statistics stops feeling like arithmetic and starts feeling like decision making under uncertainty. If null hypotheses, p-values, and significance levels have you second-guessing every step, you are far from alone.
This guide walks through the full logic of hypothesis testing, the tests you will actually be asked to run, and how to structure an assignment that earns marks. When you want a second pair of eyes, EasyAssignments is ready to help.
Why Hypothesis Testing Feels So Hard
Most students arrive at hypothesis testing after learning descriptive statistics, where the answers are concrete: a mean, a median, a standard deviation. Hypothesis testing is different because it deals in probability and inference. You are no longer describing a dataset. You are using a sample to make a claim about a much larger population you cannot see. That shift in mindset is the single biggest reason business statistics assignment help with hypothesis testing is one of the most requested topics we handle.
The vocabulary makes it worse. Null hypothesis, alternative hypothesis, type I error, type II error, significance level, critical value, test statistic, p-value: each term is precise, and using the wrong one in your write-up can cost marks even when your math is correct. The good news is that every hypothesis test, no matter how intimidating the name, follows the same underlying recipe. Once you internalize that recipe, the specific test becomes a matter of plugging into the right formula.
Business statistics adds a further layer. Your instructor does not just want a correct calculation. They want you to translate the statistical result back into a business decision. Should the company change suppliers? Is the new marketing campaign actually working? Does the training program improve productivity? Numbers are only half the assignment. Interpretation is the other half, and it is where strong students separate themselves.
The Core Logic in Plain English
Strip away the jargon and hypothesis testing answers one question: is the pattern I see in my sample real, or could it easily be the result of random chance? Suppose a company claims its average delivery time is 30 minutes, and your sample of 40 deliveries averages 34 minutes. Is that four-minute gap meaningful, or would you expect that much wobble just from sampling a handful of deliveries? Hypothesis testing gives you a formal, defensible way to decide.
You start by assuming nothing interesting is happening. This baseline assumption is the null hypothesis. You then ask how surprising your sample would be if the null were true. If your sample result would be extremely unlikely under the null, you reject the null and conclude something interesting is going on. If your result is perfectly consistent with the null, you fail to reject it. Notice the careful language: you never "prove" the alternative and you never "accept" the null. Statistics deals in evidence, not certainty.
Null and Alternative Hypotheses
The null hypothesis, written as H0, is the statement of no effect, no difference, or no relationship. It is the skeptical default. The alternative hypothesis, written as H1 or Ha, is what you are trying to find evidence for. Getting these two statements right is the foundation of the entire test, and setting them up incorrectly is the most common mistake we see in submitted drafts.
- Null (H0): the population mean delivery time equals 30 minutes.
- Alternative (H1): the population mean delivery time is not 30 minutes (two-tailed), or is greater than 30 minutes (one-tailed).
The direction of your alternative matters. A two-tailed test looks for any difference in either direction. A one-tailed test looks for a difference in a specific direction only. Choose the wrong one and your critical values and conclusion can flip.
Significance Level and the P-Value
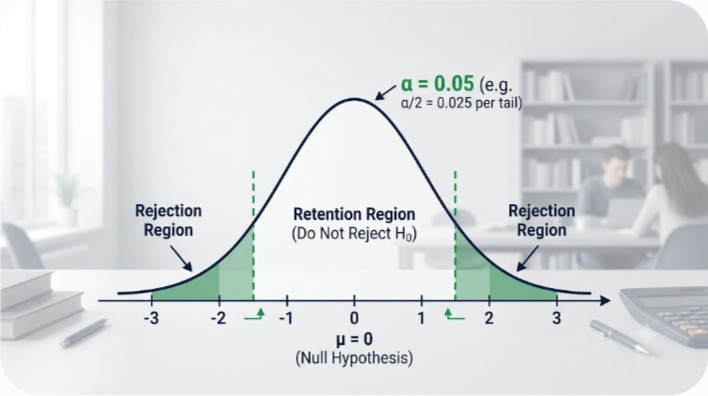
The significance level, called alpha, is the threshold you set in advance for how much risk of a false alarm you are willing to accept. The most common value in business coursework is 0.05, meaning you accept a five percent chance of rejecting a true null hypothesis. The p-value is the probability of observing a sample result as extreme as yours, or more extreme, assuming the null is true. The decision rule is simple: if the p-value is less than or equal to alpha, you reject the null.
Remember the rule of thumb: if p is low, the null must go. When your p-value falls below your chosen alpha, you have statistically significant evidence against the null hypothesis. When it does not, you fail to reject the null and report that the data did not provide sufficient evidence.
The Five-Step Hypothesis Testing Framework
Almost every hypothesis testing question, from a simple z-test to a complex ANOVA, can be solved with the same five steps. Memorize this framework and you will always know where to start, even when the specific test is unfamiliar.
- State the null and alternative hypotheses clearly, including whether the test is one-tailed or two-tailed.
- Choose the significance level, usually 0.05, and identify the correct test based on your data and sample size.
- Calculate the test statistic, whether that is a z-score, t-statistic, chi-square, or F-statistic.
- Find the p-value or compare the test statistic against the critical value from the relevant table.
- Make a decision, then interpret it in the context of the business problem you were given.
The fifth step is the one students most often rush. A grader wants to see a sentence like "at the five percent significance level, there is sufficient evidence to conclude that the new training program increases average output." That sentence connects the statistic to the real-world question, and it is worth as much as the calculation itself.
Choosing the Right Test
Half the difficulty of hypothesis testing assignments is simply selecting the correct test. The choice depends on what you are comparing, how many groups are involved, the type of data, and whether the population standard deviation is known. The table below summarizes the tests you are most likely to meet in a business statistics course.
| Test | When To Use It | Typical Business Example |
|---|---|---|
| Z-test (one sample) | Population standard deviation known and large sample | Comparing a factory's mean output to a stated target |
| T-test (one sample) | Population standard deviation unknown, small sample | Testing whether average customer spend differs from a benchmark |
| Independent samples t-test | Comparing means of two separate groups | Sales figures from two different store locations |
| Paired samples t-test | Comparing two measurements on the same subjects | Employee output before and after training |
| Chi-square test | Testing relationships between categorical variables | Whether purchase choice depends on region |
| ANOVA (F-test) | Comparing means across three or more groups | Comparing average revenue across four product lines |
When you can answer three questions, the test almost picks itself: How many groups am I comparing? Is my data numerical or categorical? Do I know the population standard deviation? Write those answers down before you touch a formula, and you will avoid the most common source of lost marks.
Stuck On Which Test To Use?
Send us your dataset and the assignment brief. We will identify the correct test, run the analysis in Excel or SPSS, and return a fully worked solution you can learn from.
Type I and Type II Errors
Because hypothesis testing works with probability, it can never be perfect. Two kinds of mistakes are always possible, and business statistics courses love to test whether you understand them. A type I error is a false positive: rejecting a true null hypothesis. Its probability is exactly alpha, the significance level you chose. A type II error is a false negative: failing to reject a null hypothesis that is actually false. Its probability is called beta.
In a business context these errors have real costs. A type I error might mean launching an expensive product change based on an effect that was not real. A type II error might mean missing a genuine improvement because the evidence was not quite strong enough. The power of a test, defined as one minus beta, measures its ability to detect a real effect. Increasing sample size is the most reliable way to boost power, which is why sample size questions appear so often in these assignments.
Common trap: a non-significant result does not prove the null hypothesis is true. It only means you did not gather enough evidence to reject it. Writing "we proved there is no difference" is a classic error that will cost you marks. Say "we failed to find sufficient evidence of a difference" instead.
Confidence Intervals and Hypothesis Tests
Confidence intervals and hypothesis tests are two sides of the same coin, and many assignments ask you to connect them. A 95 percent confidence interval gives a range of plausible values for the population parameter. If your null hypothesis value falls outside that interval, you would reject the null at the five percent level. If it falls inside, you would fail to reject. Showing that you understand this link demonstrates deeper mastery than mechanically running a test, and graders reward it.
A practical tip: when a question asks you to test a claim and also to build a confidence interval, calculate the interval first. It gives you an intuitive picture of where the true value likely sits, and it lets you sanity-check your formal test result. If the two disagree, you have made an arithmetic slip somewhere and can catch it before submitting.

Running Tests in Excel and SPSS
Modern business statistics courses rarely expect you to compute everything by hand. They want you to know the logic, then run the analysis in software and interpret the output. Excel's Data Analysis ToolPak handles t-tests, ANOVA, and regression with a few clicks. SPSS offers a menu-driven interface that produces detailed output tables. The skill your instructor is really assessing is your ability to read that output correctly.
When you get software output, focus on the p-value column, often labeled "Sig." in SPSS. Compare it to your alpha, state your decision, and interpret. Do not simply paste a screenshot of the output and stop. The interpretation is what earns marks. If your assignment requires you to show manual calculations as well, keep your work organized so a grader can follow each step of the five-step framework.
How To Structure Your Assignment
A well-organized hypothesis testing assignment is easy to grade and easy to score well on. Follow a consistent structure for each test you perform, and your report will read like the work of someone who genuinely understands the material.
Restate the Problem
Begin each question by explaining the business context and what claim is being tested, in your own words.
Show the Hypotheses
Write H0 and H1 explicitly, note the significance level, and state which test you selected and why.
Present the Working
Include the test statistic, degrees of freedom where relevant, and the p-value or critical value comparison.
Interpret the Result
Finish with a plain-language conclusion that answers the original business question directly.
Common Mistakes That Cost Marks
Over many assignments, the same errors appear again and again. Avoiding them is often the difference between an average grade and a strong one.
- Mixing up the null and alternative hypotheses, or writing them as sample statistics rather than population parameters.
- Choosing a one-tailed test when the question calls for two-tailed, or the reverse, which changes the critical value.
- Confusing the significance level with the p-value, or reporting the p-value as the probability that the null is true.
- Using a z-test when the population standard deviation is unknown and the sample is small, where a t-test is correct.
- Stopping at the calculation without interpreting the result in business terms.
- Claiming a non-significant result proves the null hypothesis.
If you review your draft against this list before submitting, you will catch most of the errors that quietly drain marks from otherwise solid work.
When To Get Expert Help
There is no shame in seeking guidance on a topic as conceptually demanding as hypothesis testing. Getting help is most valuable when a deadline is close and you are stuck on test selection, when your software output does not match your hand calculations, or when you understand the mechanics but struggle to interpret results in business language. A worked solution with clear explanations can turn a confusing topic into one you finally understand.
EasyAssignments provides step-by-step solutions that are meant to be learning tools, not just answers. Our approach walks through each stage of the five-step framework, explains why a particular test was chosen, and shows how to phrase the final interpretation. You can order support through our order page or reach the team directly through our contact page if you want to discuss your brief first.
Frequently Asked Questions
What is the easiest way to understand hypothesis testing?
Think of it as a courtroom. The null hypothesis is "innocent until proven guilty." You assume no effect exists, then check whether your sample provides strong enough evidence to reject that assumption. If the evidence is strong enough, measured by a low p-value, you reject the null. This framing helps most business statistics students grasp the logic quickly.
How do I know whether to use a t-test or a z-test?
Use a z-test when the population standard deviation is known and the sample is large. Use a t-test when the population standard deviation is unknown, which is the case in most real business scenarios, especially with smaller samples. In practice, business coursework uses the t-test far more often than the z-test.
Can you help with SPSS or Excel output as well as manual calculations?
Yes. EasyAssignments provides business statistics assignment help with hypothesis testing across both manual methods and software. We can run your analysis in Excel or SPSS, explain each part of the output, and show the matching hand calculations if your brief requires them.
What does a p-value of 0.03 actually mean?
It means that if the null hypothesis were true, there would be only a three percent chance of seeing a sample result as extreme as yours. Since 0.03 is below the common alpha of 0.05, you would reject the null hypothesis and report a statistically significant result at the five percent level.
Turn Hypothesis Testing Into Your Best Grade Yet
Whether you need a single question solved or a full statistics report, EasyAssignments delivers clear, step-by-step solutions built to help you actually understand the material.