

Regression Analysis Assignment Help for College Students
Regression analysis assignment help gives you a clear path from a messy dataset to a report you actually understand. If scatter plots, coefficients, and p-values feel like a foreign language, you are not alone, and there is a structured way through it.
This guide walks you through what regression really measures, the models you will meet in college coursework, the software professors expect you to use, and the interpretation mistakes that quietly cost marks. By the end you will know exactly how to approach your next assignment with confidence.
What Regression Analysis Actually Measures
At its core, regression analysis is a way of describing how one variable changes as others change. You have an outcome you care about, called the dependent variable, and one or more inputs you think influence it, called independent variables or predictors. Regression estimates the relationship between them and puts a number on it, so instead of vaguely saying "study hours seem to affect grades," you can say how much a grade is expected to rise for each extra hour of study, and how confident you can be in that estimate.
Regression analysis assignment help usually starts here, because many students can run the software but stumble when asked what the numbers mean. The whole point of the technique is prediction and explanation. Prediction asks what value the outcome is likely to take given the inputs. Explanation asks which predictors matter, in which direction, and by how much. A good assignment answers both, and a good analyst always keeps the research question in view rather than drowning in output.
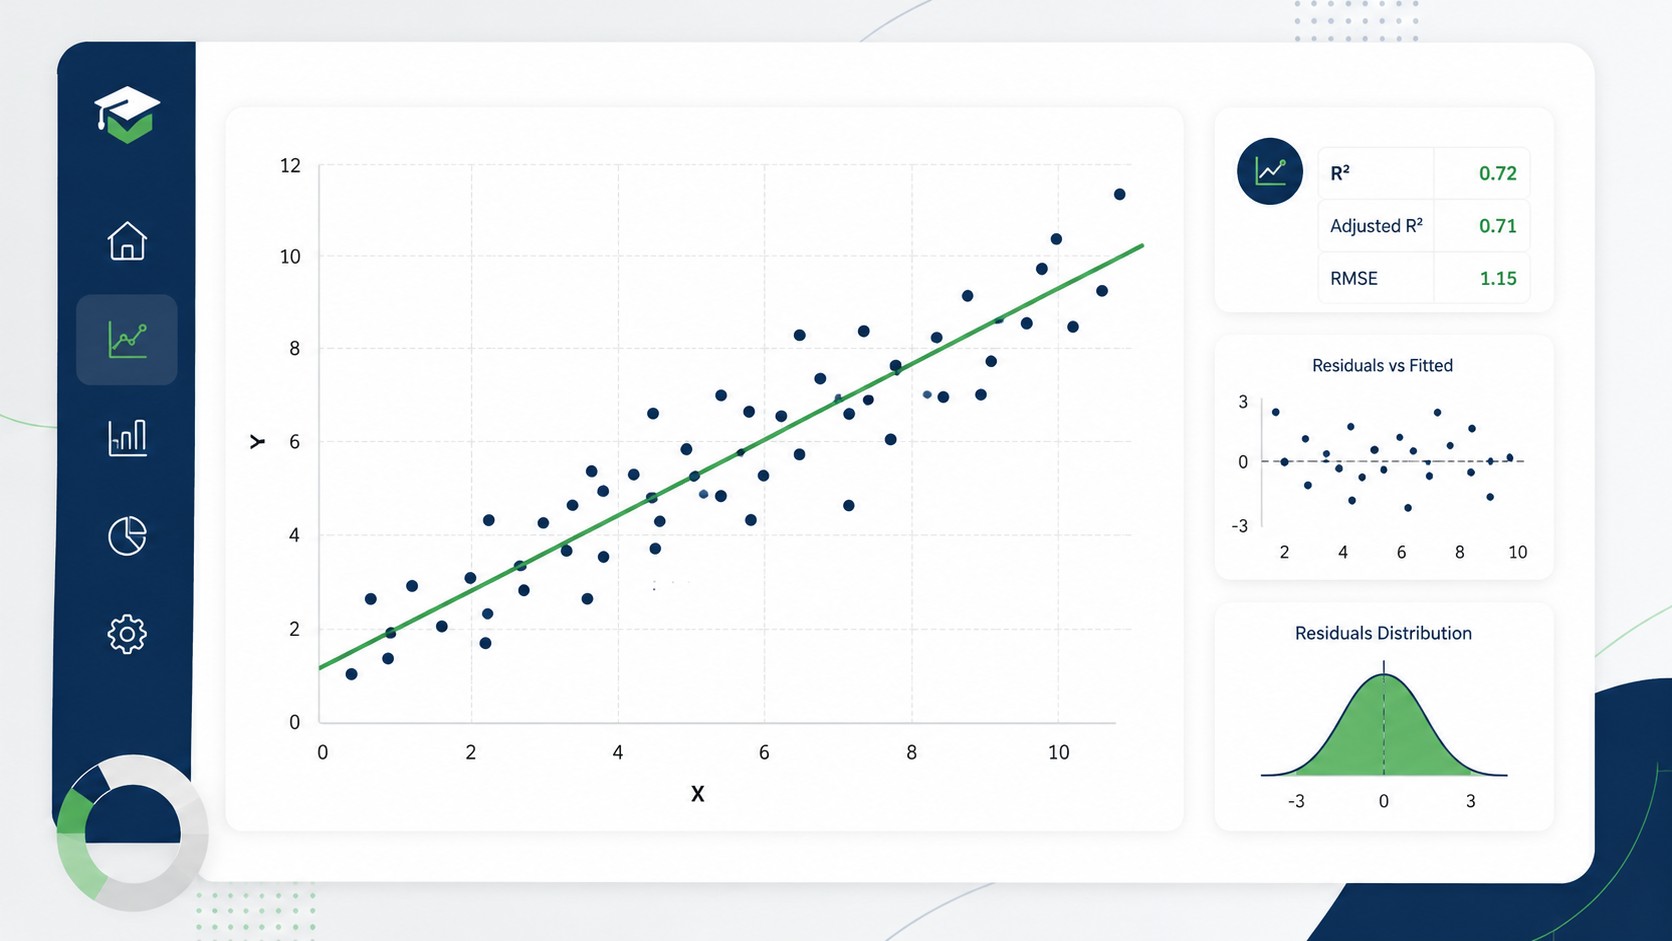
Think of it like drawing the best possible line, or surface, through a cloud of data points. The method most courses teach, ordinary least squares, chooses the line that makes the total squared distance between the points and the line as small as possible. That single idea underpins a huge share of applied statistics in economics, psychology, health sciences, business, and beyond.
Key idea: A regression coefficient tells you the expected change in the outcome for a one-unit change in a predictor, holding the other predictors constant. That last phrase, "holding the others constant," is where most exam marks are won or lost.
The Main Types of Regression You Will Meet
College assignments rarely stop at a single model. As you progress, professors introduce variations designed for different kinds of data and different questions. Knowing which model fits which situation is half the battle, and choosing wrongly is one of the fastest ways to lose credit even when your arithmetic is perfect.
Simple Linear Regression
This is where almost everyone begins. You have one predictor and one continuous outcome, and you fit a straight line. For example, predicting exam score from hours studied. The output gives you a slope, an intercept, and measures of how well the line fits. It is the foundation for everything else, so it pays to understand it thoroughly before moving on.
Multiple Linear Regression
Real questions rarely involve just one cause. Multiple regression lets you include several predictors at once, for example predicting salary from education, years of experience, and industry together. The strength here is the ability to isolate the effect of each predictor while controlling for the others, which is exactly what "holding constant" means in practice.
Logistic Regression
When your outcome is a yes or no category rather than a number, such as pass or fail, or purchased or not purchased, linear regression breaks down. Logistic regression models the probability of an event instead, and reports results as odds ratios. It is extremely common in health, social science, and business coursework, and it trips up many students because the interpretation differs from the linear case.
Polynomial and Nonlinear Regression
Sometimes the relationship curves rather than following a straight line. Polynomial terms and other nonlinear forms let you capture bends in the data, though they demand extra care so you do not overfit and end up describing noise rather than a real pattern.
| Regression Type | Outcome Variable | Typical Use Case | Key Output |
|---|---|---|---|
| Simple linear | Continuous | One predictor, one outcome | Slope, intercept, R-squared |
| Multiple linear | Continuous | Several predictors at once | Coefficients, adjusted R-squared |
| Logistic | Binary category | Probability of an event | Odds ratios, log-odds |
| Polynomial | Continuous | Curved relationships | Curved fit, higher-order terms |
Reading Regression Output Without Panic
Software makes it easy to generate a wall of numbers and hard to know which ones matter. Whether you use SPSS, R, Stata, or Excel, the same core quantities appear, just labeled slightly differently. Learning to read them in a fixed order removes most of the anxiety and prevents you from cherry-picking whatever supports your hoped-for conclusion.
Coefficients and Their Signs
Each predictor gets a coefficient. A positive coefficient means the outcome rises as that predictor rises; a negative one means it falls. The size of the coefficient tells you the magnitude of the effect in the units of your variables. Always describe both direction and size in plain language, because that is what graders look for.
P-values and Significance
The p-value for each coefficient tests whether the relationship could plausibly be zero. A small p-value, conventionally below 0.05, suggests the predictor has a statistically detectable effect. A large one suggests you cannot rule out that the true effect is zero. Significance is not the same as importance, though, and a good write-up says so rather than treating every star in the output as a victory.
R-squared and Model Fit
R-squared reports the proportion of variation in the outcome that your model explains, on a scale from zero to one. Higher generally means a better fit, but context matters enormously. In physics you might expect values near one, while in messy human behavior a much lower value can still be meaningful. Adjusted R-squared is the version to quote when you have multiple predictors, since it penalizes adding useless variables.
Common trap: A high R-squared does not prove your model is correct, and a significant coefficient does not prove causation. Correlation in a regression is still correlation unless your study design supports a causal claim. Stating causation from observational data is one of the most frequent reasons assignments lose marks.
Stuck on a Regression Assignment Right Now?
Send us your dataset, your prompt, and your deadline. You will get a clear, step-by-step solution with interpretation you can actually defend in class.
The Assumptions Behind the Numbers
Regression is only trustworthy when certain assumptions hold. Professors love to test whether you checked them, because skipping this step is what separates a mechanical answer from a competent one. You do not need to memorize proofs, but you should be able to name the assumptions, check each with a plot or test, and say what to do when one fails.
- Linearity: the relationship between predictors and outcome is genuinely linear. Check with residual plots and consider transformations if it curves.
- Independence: observations do not influence one another. Time-series and clustered data often violate this and need special methods.
- Homoscedasticity: the spread of residuals stays roughly constant across predicted values. A funnel shape in the residual plot is a warning sign.
- Normality of residuals: the errors are approximately normally distributed. A Q-Q plot is the standard visual check.
- No severe multicollinearity: predictors are not too strongly correlated with each other. The variance inflation factor helps you spot this.
When an assignment asks you to "evaluate the model," this checklist is usually what the marker wants to see. Naming each assumption, showing the diagnostic you used, and stating your conclusion in one sentence each will earn credit that raw output never will.
Software Every Student Should Know
Different courses standardize on different tools, and part of doing well is meeting your professor where they are. The underlying statistics are identical across programs; only the buttons and syntax change. If you learn to translate output between them, you become far more flexible.
SPSS
Menu-driven and popular in psychology and social sciences. Great for students who prefer clicking through dialog boxes over writing code, with clean, labeled output tables.
R
Free, powerful, and the standard in many statistics and data programs. Steeper to learn but unbeaten for reproducible analysis and publication-quality graphics.
Stata
A favorite in economics and public health for its clear commands and strong documentation. Excellent for panel data and causal-inference coursework.
Excel
Underrated for intro courses. The Data Analysis add-in runs regression quickly and is often all a first assignment requires, though it strains under complex models.

A Step-by-Step Workflow for Any Regression Assignment
Most regression assignments follow a predictable rhythm. Building a repeatable workflow means you stop reinventing your approach every time and instead move through the same reliable stages, which also makes your write-up cleaner and easier for a grader to follow.
- Restate the question: identify the outcome, the predictors, and what a good answer would look like before touching the data.
- Explore the data: summarize each variable, look at distributions, and plot key relationships. Catch typos, outliers, and missing values now.
- Choose the model: match the model type to the outcome, linear for continuous, logistic for binary, and so on.
- Fit and inspect: run the regression and read coefficients, p-values, and fit measures in order.
- Check assumptions: use residual and diagnostic plots, and note any violations along with your remedies.
- Interpret in plain English: translate every important number into a sentence a non-statistician could understand.
- Write it up: present tables cleanly, label everything, and tie your conclusions back to the original question.
Pro tip: Write your interpretation as if explaining to a friend who has never taken statistics. If you can say what a coefficient means in one clear sentence, you understand it, and that clarity is exactly what earns top marks.
How EasyAssignments Supports Your Regression Work
Good regression analysis assignment help is not about handing you a black-box answer; it is about giving you a solution you can read, learn from, and defend. When you work with EasyAssignments, the goal is to leave you understanding the model, not just holding a completed file. That means annotated output, plain-language interpretation, and reasoning you can repeat on your own next time.
Whether you are wrestling with a first simple linear model or a graduate-level logistic analysis with tricky diagnostics, support is tailored to your course, your software, and your deadline. You keep control of your learning while getting unstuck on the parts that are genuinely hard. If you want to talk through your specific brief, you can reach the support team or request a free quote and share your prompt.
Frequently Asked Questions
Is getting regression analysis assignment help considered cheating?
Using help to understand concepts, check your interpretation, and learn the correct workflow is a normal part of studying, much like a tutor or study group. The key is that you should understand and be able to explain the work you submit. Always follow your institution's academic integrity policy and use any solution as a learning tool.
Which regression type should I use for my data?
Start with your outcome variable. A continuous outcome usually calls for linear regression, a binary yes or no outcome calls for logistic regression, and a curved relationship may need polynomial terms. Matching the model to the outcome is the single most important choice, so confirm it before running anything.
Do I need to code, or can I use Excel?
It depends on your course. Many introductory assignments can be completed with the Excel Data Analysis add-in or the menus in SPSS, so no coding is required. More advanced work in R or Stata involves short commands, but they are learnable, and help is available if the syntax is the obstacle.
What is the most common mistake in regression assignments?
Claiming causation from an observational regression is the classic error, closely followed by ignoring assumption checks. Reporting numbers without interpreting them in plain language is another frequent one. Avoiding these three habits alone will lift most grades noticeably.
Turn a Confusing Dataset Into a Clear Report
Get regression analysis assignment help that leaves you understanding the model, not just holding an answer. Share your brief today and move forward with confidence.