

R Programming Assignment Help: Data Analysis Made Simple
R programming assignment help gives you a clear path through data cleaning, statistical testing, and visualization when your coursework starts to feel like a wall of red error messages. Whether your task involves a messy CSV file, a regression model, or a full R Markdown report, the right guidance turns confusion into working, well-explained code.
At EasyAssignments, we help students understand what their R assignments are really asking, build analysis step by step, and submit work that is accurate, readable, and properly interpreted.
What R Programming Assignment Help Actually Covers
R is a language built specifically for statistics and data analysis. It is used across universities in statistics, data science, economics, psychology, biology, public health, and business analytics courses. Because it sits at the meeting point of coding and statistics, R assignments often test two skill sets at once: you need to write code that runs, and you need to understand the statistical ideas behind the output.
Good R programming assignment help addresses both sides. It is not only about fixing a script that refuses to run. It is also about knowing which test fits your research question, how to prepare your data so the results are valid, and how to explain what a p-value, coefficient, or confidence interval actually means in the context of your dataset.
Typical R coursework includes importing data from CSV, Excel, or SPSS files, cleaning and reshaping that data, producing descriptive statistics, building charts, running hypothesis tests or regression models, and writing up the findings. Some assignments go further into machine learning, time series forecasting, text analysis, or interactive dashboards with Shiny.
Key idea: An R assignment is rarely graded on code alone. Most instructors look for correct methods, clean and commented code, well-labeled visualizations, and a clear interpretation of results. Strong submissions balance all four.

Why Students Find R Assignments Challenging
Many students arrive in an R course with little or no programming background. Others know Python or Excel well but find that R behaves differently from what they expect. Here are the most common sticking points.
Unfamiliar Syntax and Data Structures
R has its own way of doing things. Vectors, lists, matrices, data frames, and factors all behave differently, and mixing them up causes subtle bugs. Indexing starts at 1 rather than 0, the assignment operator is usually <-, and square brackets can return a data frame or a vector depending on how you use them. These details trip up beginners constantly.
Too Many Packages and Approaches
R has a huge ecosystem of packages on CRAN, which is a strength but also a source of confusion. There are often several ways to do the same task. You can filter rows with base R subsetting, with subset(), or with dplyr::filter(). When tutorials, textbooks, and lecture notes each use a different style, it becomes hard to know which approach your instructor expects.
The Statistics Behind the Code
Running lm() takes one line. Choosing the right model, checking its assumptions, and interpreting the output correctly takes real statistical understanding. Students often lose marks not because their code fails but because they picked an unsuitable test, ignored assumption checks, or misread the summary table.
Cryptic Error Messages
Messages such as "object not found" or "non-numeric argument to binary operator" are short and do not always point to the real cause. Without experience, a student can spend hours hunting for a single missing quotation mark or an unloaded package.
Tight Deadlines Across Multiple Courses
Data analysis takes time. Cleaning a real dataset can take longer than the analysis itself, and when an R project lands in the same week as exams and other deadlines, the pressure builds quickly.
Core R Skills Every Data Analysis Assignment Tests
Most R data analysis tasks follow a predictable pattern. If you understand each stage, you will find assignments much easier to plan and complete.
1. Importing Data
You need to get your data into R correctly before anything else. Base R offers read.csv(), while the readr package provides read_csv(), which is faster and gives clearer messages about column types. Excel files are commonly loaded with the readxl package, and SPSS, Stata, or SAS files with the haven package. Always check the result with str(), head(), or glimpse() to confirm that numbers were read as numbers and dates as dates.
2. Cleaning and Wrangling
Real datasets are messy. Common cleaning tasks include:
- Renaming unclear column names so they are consistent and easy to type.
- Handling missing values with
is.na(),drop_na(), or thena.rm = TRUEargument in summary functions. - Converting variable types, for example turning text categories into factors with
factor(). - Filtering rows and selecting columns with
filter()andselect(). - Creating new variables with
mutate(). - Reshaping data between wide and long formats with
pivot_longer()andpivot_wider()from tidyr. - Joining datasets with
left_join()and related functions.
3. Exploratory Data Analysis
Before modeling, you should understand your data. This means calculating means, medians, standard deviations, and counts, often by group using group_by() and summarise(). It also means looking for outliers, skewed distributions, and unexpected values that could distort your results.
4. Visualization
The ggplot2 package is the standard for charts in most R courses. It builds plots in layers: you map variables to aesthetics with aes(), then add geometries such as geom_point(), geom_histogram(), geom_boxplot(), or geom_line(). Marks are often awarded for clear titles, labeled axes with units, sensible colors, and a chart type that actually suits the question.
5. Statistical Testing and Modeling
Depending on your course, you may need to run t.test() for comparing means, chisq.test() for categorical associations, aov() for ANOVA, cor.test() for correlations, lm() for linear regression, or glm() with family = binomial for logistic regression. Each comes with assumptions you are expected to check, such as normality of residuals or equal variances.
6. Reporting Results
Many instructors ask for an R Markdown or Quarto document that combines code, output, and written explanation in a single file. These documents can be rendered to HTML, PDF, or Word, and they make your analysis reproducible, which is a core principle of modern data work.
Base R vs tidyverse: Which Style Should You Use?
One of the first decisions in any R assignment is which coding style to follow. Both are valid, and many real projects mix them. The best choice is usually the one your course teaches. The table below compares the two for common data analysis tasks.
| Task | Base R Approach | tidyverse Approach | Student Tip |
|---|---|---|---|
| Import a CSV | read.csv() |
read_csv() (readr) |
Check column types right after loading. |
| Filter rows | df[df$age > 18, ] |
filter(df, age > 18) |
tidyverse code is often easier to read aloud. |
| Create a new column | df$bmi <- ... |
mutate(df, bmi = ...) |
mutate can create several columns at once. |
| Group summaries | aggregate() or tapply() |
group_by() + summarise() |
Remember to handle missing values. |
| Plotting | plot(), hist(), boxplot() |
ggplot() (ggplot2) |
Base plots are quick; ggplot2 is more polished. |
| Chaining steps | Nested functions or native pipe |> |
Pipe %>% or |> |
The native pipe needs R 4.1 or later. |
If your instructor has not specified a style, stay consistent within one script. Switching between styles line by line makes code harder to follow and harder to grade.
A Step-by-Step Workflow for R Data Analysis Assignments
A reliable workflow saves time and prevents the panic of discovering a problem the night before a deadline. Here is a process that works for most R data analysis tasks.
Step 1: Read the Brief Carefully
Identify the research questions, required methods, allowed packages, output format, and marking criteria. Highlight words like "compare", "predict", "describe", or "test", because they hint at which statistical methods are expected.
Step 2: Set Up a Clean Project
Use an RStudio Project so that file paths stay consistent. Keep your raw data in a separate folder and never overwrite it. Load all packages at the top of your script so anyone running it can see the dependencies at a glance.
Step 3: Inspect and Clean the Data
Look at the structure, count missing values, and check the range of each variable. Document every cleaning decision with a short comment, for example why you removed certain rows or recoded a category. Instructors appreciate transparency.
Step 4: Explore Before You Model
Produce summary tables and a few quick plots. This stage often reveals problems such as a numeric column stored as text or a variable with extreme outliers, both of which would undermine your models.
Step 5: Choose and Run the Right Analysis
Match the method to the question and the data type. Continuous outcome with one or more predictors suggests linear regression. A binary outcome suggests logistic regression. Comparing group means suggests a t-test or ANOVA. Then check assumptions using residual plots, normality checks, or other diagnostics your course covers.
Step 6: Interpret, Do Not Just Print
Raw output is not an answer. Explain what each important number means in plain language and in the context of the data. State whether results are statistically significant, how large the effect is, and what limitations apply.
Step 7: Knit, Review, and Proofread
Render your R Markdown or Quarto file from a fresh session to confirm that everything runs from top to bottom. Then read the output as if you were the marker: are charts labeled, is code commented, and does every section answer part of the brief?
Stuck on Your R Assignment Right Now?
Share your brief and dataset with EasyAssignments. We will review the requirements and help you move from confusing output to a clear, well-structured data analysis.
Common R Errors and How to Fix Them
Most R errors fall into a small number of patterns. Learning to recognize them will save you hours.
- Error: object 'x' not found. The variable does not exist in your environment. Check spelling and capitalization, since R is case sensitive, and make sure the line that creates the object has actually been run.
- could not find function "..." The package that provides the function is not loaded. Add
library(packagename)at the top of your script, and install the package first if needed. - non-numeric argument to binary operator. You are doing math on text. A column that looks numeric may have been imported as character because of stray symbols like commas or currency signs. Clean it and convert it with
as.numeric(). - arguments imply differing number of rows. You are combining vectors of different lengths into a data frame. Check the length of each input.
- subscript out of bounds. You are asking for an element, row, or column that does not exist. Confirm dimensions with
dim()orlength(). - Unexpected NA results. Functions like
mean()return NA when any value is missing. Usena.rm = TRUE, but also think about why the data are missing. - Factor level surprises. Categorical variables may appear in an odd order in charts and models. Set the order deliberately with
factor(x, levels = ...).
A useful habit is to read the full error message, run your code one line at a time, and inspect objects as you go. Most bugs reveal themselves quickly when you stop running the whole script at once.
Academic integrity matters: Always follow your university's rules on collaboration and outside help. Use expert support to understand methods, check your approach, and learn from worked explanations, and make sure the work you submit reflects your own understanding.
How EasyAssignments R Programming Assignment Help Works
EasyAssignments offers R programming assignment help designed around how data analysis coursework is actually graded. The focus is on correct methods, readable code, and explanations you can learn from and discuss confidently.
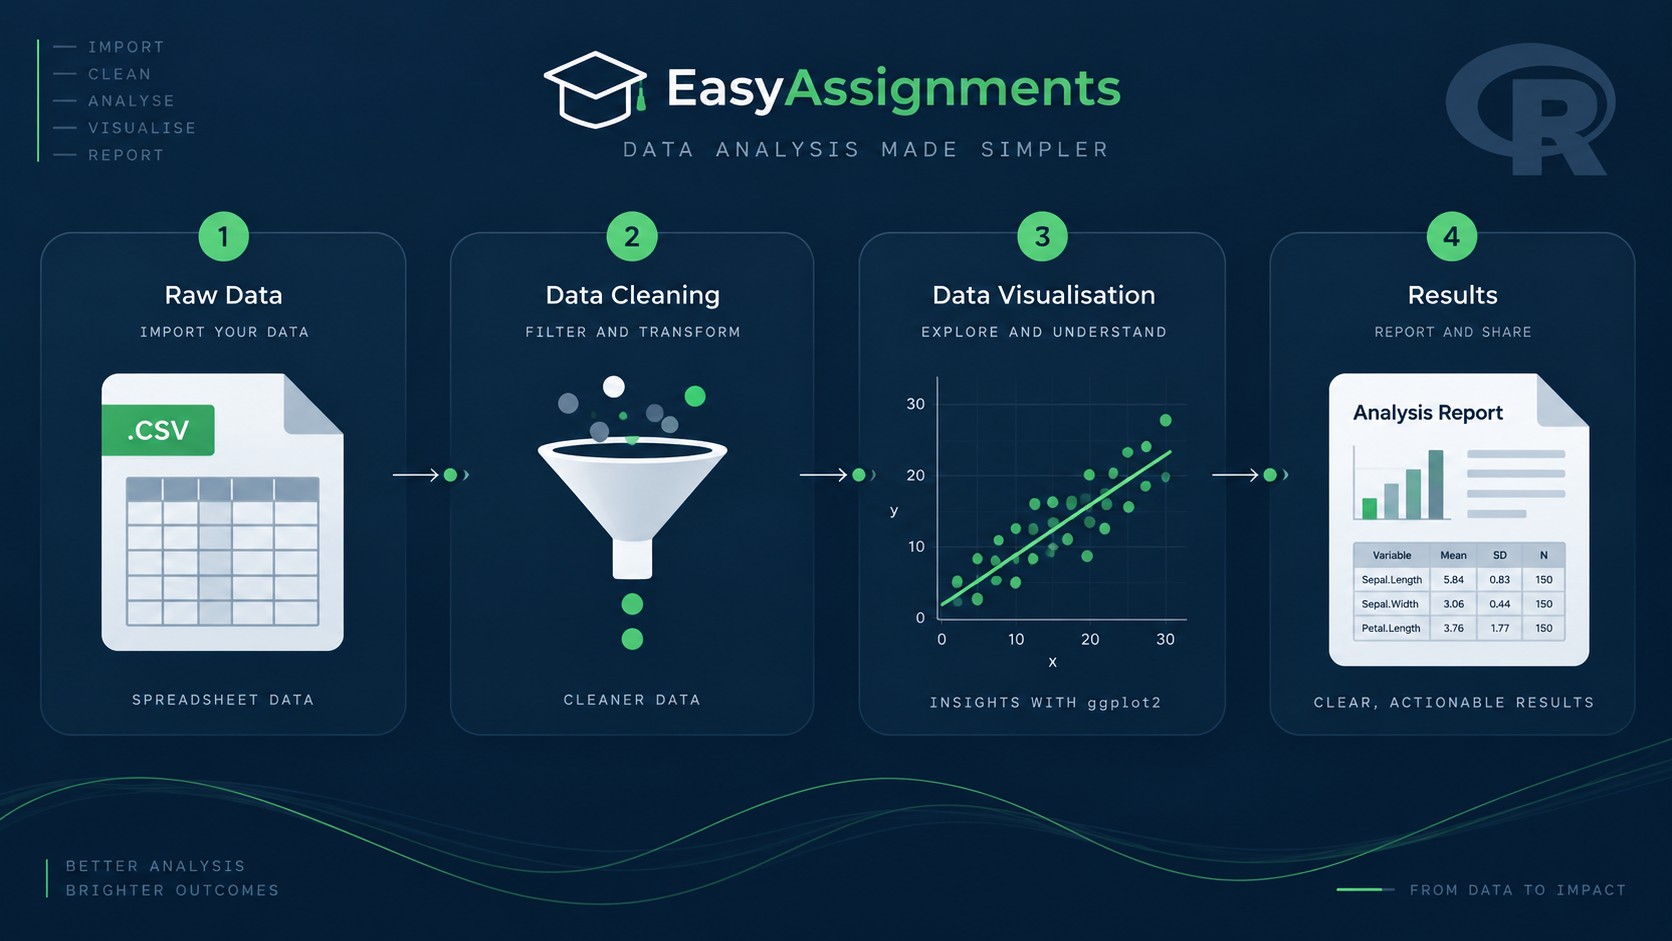
When you reach out, share your assignment brief, the dataset, any lecture notes or required packages, and your deadline. This context helps match the work to your course level and the style your instructor expects, whether that is base R, tidyverse, or a mix.
Clean, Commented Code
Scripts are organized into logical sections with comments that explain what each block does and why.
Correct Statistical Methods
Tests and models are chosen to fit your research questions and data, with assumption checks where relevant.
Readable Visualizations
Charts come with clear titles, labeled axes, and designs that make the key findings easy to see.
Plain-Language Interpretation
Results are explained clearly, so you understand what the numbers mean and can discuss them with confidence.
Support covers a wide range of R tasks, including descriptive statistics, hypothesis testing, regression and ANOVA, data visualization, R Markdown and Quarto reports, and more advanced topics such as time series, clustering, and classification models where your course requires them.
Who Benefits from R Programming Assignment Help?
R shows up in far more degrees than many students expect. Help with R data analysis is useful for:
- Statistics and mathematics students working through probability, inference, and modeling coursework.
- Data science learners building end-to-end projects from data collection to reporting.
- Psychology and social science students analyzing survey and experimental data.
- Public health and biology students handling biostatistics, clinical, or ecological datasets.
- Economics and business students running regressions, forecasting, and market analysis.
- Postgraduate researchers preparing analysis chapters for theses and dissertations.
Whatever your field, the goal is the same: an analysis that is methodologically sound, clearly presented, and easy for your marker to follow.
Tips to Get Better at R Data Analysis on Your Own
Expert help works best alongside your own practice. These habits will make every future R assignment easier.
Practice With Small Datasets
R includes built-in datasets such as mtcars, iris, and airquality. They are small enough to understand fully, which makes them ideal for practicing filtering, summarizing, and plotting without the noise of a large real-world file.
Use the Built-In Help
Typing ?function_name opens the documentation, and most help pages include runnable examples at the bottom. Package vignettes, which you can browse with browseVignettes(), often provide beginner-friendly walkthroughs.
Write Code for a Reader
Use descriptive object names like sales_clean instead of df2. Add short comments. Break long pipelines onto separate lines. Readable code is easier to debug and tends to earn better marks.
Learn to Build a Minimal Example
When something breaks, try to reproduce the problem with a tiny piece of data. This process often reveals the cause on its own, and it makes it much easier to ask a tutor or classmate for targeted help.
Revisit the Statistics
Set aside time to review the theory behind the tests you use. Knowing why a method works makes it far easier to choose the right one and to write a convincing interpretation.
Start Early
Data problems surface late. Opening the dataset in the first few days after an assignment is released gives you time to deal with surprises calmly instead of in a rush.
Frequently Asked Questions About R Programming Assignment Help
What does R programming assignment help include?
R programming assignment help can cover data import, cleaning and wrangling, exploratory analysis, ggplot2 visualizations, statistical tests, regression models, and R Markdown or Quarto reports, along with clear explanations of the results.
Can you work with tidyverse or base R, depending on my course?
Yes. Share your lecture notes or instructions, and the code can follow the style your course teaches, whether that is base R, tidyverse, or a combination of both.
Will the code include comments and explanations?
Yes. Well-structured, commented code and plain-language interpretation are central to useful data analysis support, so you can understand each step and discuss your work confidently.
How do I get started with EasyAssignments for my R data analysis task?
Visit the order page to request a free quote, and include your brief, dataset, and deadline. If you have questions first, you can contact our support team.
Making R Data Analysis Simple
R is a powerful tool, and once its core patterns click, data analysis becomes far less intimidating. Focus on a clean workflow, choose methods that fit your questions, visualize before you model, and always explain what your results mean. When deadlines stack up or a dataset refuses to cooperate, R programming assignment help from EasyAssignments can help you get back on track with clear, well-reasoned work you can learn from.
Turn Your Dataset Into Clear, Confident Results
Get R programming assignment help from EasyAssignments for data cleaning, visualization, statistical modeling, and reporting.