

Hypothesis Testing Assignment: A Solved Example Walkthrough
If a hypothesis testing assignment has you staring at a blank page, you are not alone. The concept sounds abstract, but the process is a fixed sequence of steps that works the same way every single time, no matter the dataset.
In this guide we solve a complete example from start to finish, showing exactly how to state your hypotheses, choose a test, compute the statistic, find the p-value, and write a conclusion your instructor will accept. Follow along and the mystery disappears.
What a Hypothesis Testing Assignment Actually Asks You to Do
A hypothesis testing assignment gives you a claim about a population and a sample of data, then asks you to decide whether the data support that claim. The main keyword here is simple: you are testing a hypothesis. You never prove anything with certainty. Instead, you weigh the evidence and decide whether it is strong enough to reject a default assumption.
That default assumption is called the null hypothesis, written H0. It usually states that nothing interesting is happening: no difference, no effect, no relationship. The alternative hypothesis, written H1 or Ha, is the claim you suspect might be true, such as a difference existing or a mean being higher than expected. Your entire assignment revolves around collecting evidence against H0.
Instructors grade these assignments on structure as much as arithmetic. A perfect calculation with a vague conclusion loses marks, while a clearly reasoned answer with one small slip usually keeps most of them. So the goal is not just to crunch numbers but to communicate a decision and justify it. Let us break the process into the five reliable steps that apply to almost every problem you will meet.
The Five Steps of Every Hypothesis Test
No matter how the question is dressed up, hypothesis testing follows the same skeleton. Learn these five steps once and you can apply them to a mean, a proportion, two groups, or a correlation with only minor changes.
- State the hypotheses. Write H0 and H1 in symbols and in words. Decide whether the test is one-tailed or two-tailed.
- Choose the significance level. This is alpha, the risk you accept of rejecting a true null. It is usually set at 0.05, sometimes 0.01 or 0.10.
- Select and compute the test statistic. Pick the right formula (z, t, chi-square, F) based on your data, then plug in the numbers.
- Find the p-value or critical value. Compare your statistic to a reference distribution to see how extreme it is.
- Make a decision and conclude. Reject or fail to reject H0, then explain what that means in the context of the original question.
Notice that only step three changes much between different problem types. The logic of stating hypotheses, setting alpha, and interpreting the result stays constant. Once this rhythm becomes automatic, a hypothesis testing assignment turns from a puzzle into a checklist.
Quick tip: Always write your hypotheses before you touch a calculator. Deciding the direction of the test first prevents the most common student mistake: running a two-tailed test when the question clearly calls for a one-tailed one, or the reverse.
A Fully Solved Example: Testing a Population Mean
Let us work through a realistic problem you might find in an introductory statistics course. We will use a one-sample t-test, which is one of the most frequently assigned scenarios.
The problem statement
A coffee shop claims that its large drink contains, on average, 350 milliliters of liquid. A skeptical customer suspects the true average is different. She collects a random sample of 25 large drinks and measures a sample mean of 342 milliliters with a sample standard deviation of 18 milliliters. At a significance level of 0.05, is there enough evidence to conclude that the average volume differs from 350 milliliters?
Step 1: State the hypotheses
The claim being challenged is that the mean equals 350. The customer suspects it is simply different, not specifically higher or lower, so this is a two-tailed test. We write:
- H0: the population mean equals 350 milliliters (no difference from the claim).
- H1: the population mean does not equal 350 milliliters (a real difference exists).
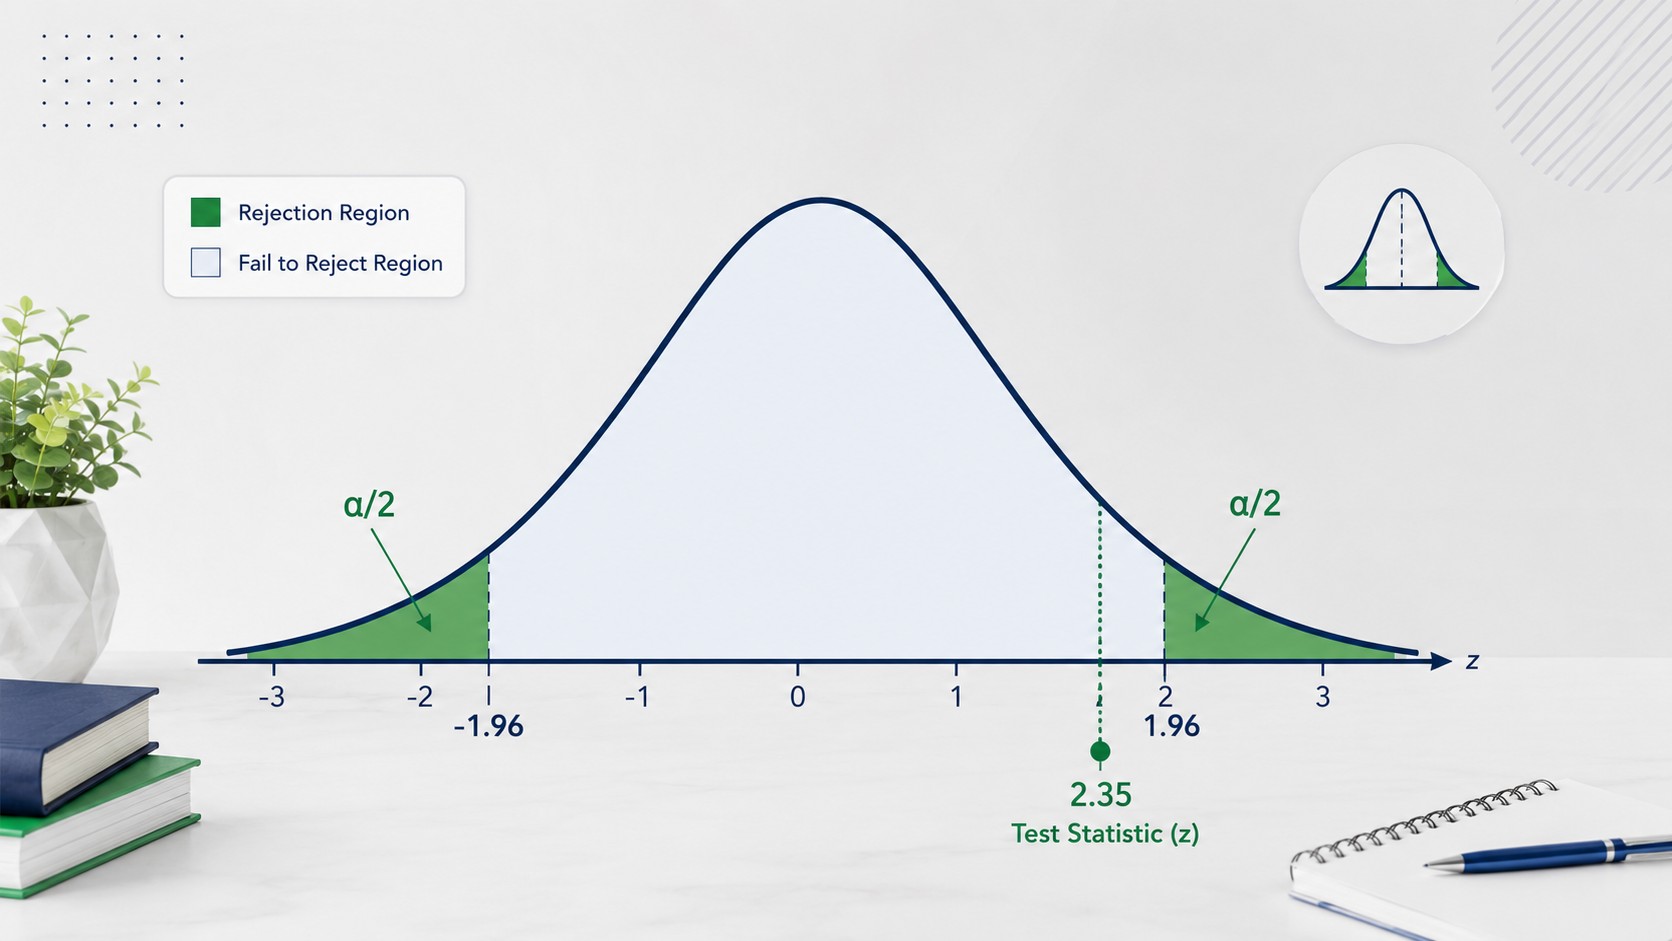
Because the alternative uses "does not equal," we split the significance level across both tails of the distribution. That detail matters when we look up our critical value later.
Step 2: Choose the significance level
The problem tells us to use alpha equal to 0.05. In a two-tailed test, this means 0.025 sits in each tail. If our result falls into either of those extreme regions, we will reject the null hypothesis. Stating alpha explicitly here shows the grader you understand the risk you are accepting.
Step 3: Compute the test statistic
Because we do not know the population standard deviation and the sample is small, we use the t-statistic rather than the z-statistic. The formula subtracts the claimed mean from the sample mean, then divides by the standard error, which is the sample standard deviation divided by the square root of the sample size.
The standard error equals 18 divided by the square root of 25, which is 18 divided by 5, giving 3.6. The numerator is 342 minus 350, which equals negative 8. Dividing negative 8 by 3.6 gives a t-statistic of approximately negative 2.22. This value tells us how many standard errors our sample mean sits away from the claimed mean.
Step 4: Find the critical value or p-value
Our test has 24 degrees of freedom, calculated as the sample size of 25 minus 1. For a two-tailed test at alpha 0.05 with 24 degrees of freedom, the critical t-values are approximately positive and negative 2.064. Any test statistic beyond those boundaries lands in the rejection region.
Our computed statistic of negative 2.22 is more extreme than negative 2.064, so it falls inside the rejection region. If you use software or a t-table to find the p-value instead, you get a value of roughly 0.036, which is smaller than our alpha of 0.05. Both approaches point to the same decision, which is a good consistency check.
Step 5: Make a decision and write the conclusion
Since our test statistic falls in the rejection region and the p-value is below alpha, we reject the null hypothesis. Now translate that into plain language for the grader: at the 5 percent significance level, there is sufficient evidence to conclude that the average volume of the large drink differs from 350 milliliters. The sample suggests the true average may be lower than the advertised amount.
Remember: Rejecting H0 does not prove the alternative is exactly true. It means the data would be unlikely if the null were correct. Careful wording like "there is sufficient evidence to conclude" keeps your statistical claim honest and earns full marks.
Choosing the Right Test for Your Data
The single biggest decision in step three is which test statistic to use. Picking the wrong one invalidates everything that follows, so it is worth slowing down. The choice depends on what you are measuring, how many groups you have, and what you know about the population. The table below maps common assignment scenarios to the right test.
| Scenario | Test to Use | When It Applies |
|---|---|---|
| One mean, population SD known | Z-test | Large sample or known population standard deviation |
| One mean, population SD unknown | One-sample t-test | Small sample, estimate SD from the data |
| Comparing two group means | Two-sample t-test | Independent samples with continuous outcomes |
| Before and after measurements | Paired t-test | Same subjects measured twice |
| One or more proportions | Z-test for proportions | Categorical yes/no outcomes |
| Relationship between categories | Chi-square test | Frequency counts in a contingency table |
| Comparing three or more means | ANOVA (F-test) | Multiple groups at once |
When in doubt, ask two questions: is my outcome a number or a category, and how many groups am I comparing? Those two answers narrow the field quickly. If your outcome is a measured quantity like weight or time, you are usually in t-test or ANOVA territory. If it is a count or a category, you are looking at a proportion test or chi-square.
Stuck on Which Test to Use?
Statistics assignments punish small mistakes heavily. If you are unsure whether your problem needs a t-test, chi-square, or ANOVA, our tutors can check your setup and walk you through the reasoning before you submit.
Understanding the P-Value Without the Jargon
The p-value is where most students lose confidence, so it deserves a clear explanation. The p-value is the probability of getting a sample result as extreme as yours, or more extreme, assuming the null hypothesis is true. A small p-value means your data would be surprising if nothing were really going on, which is evidence against the null.
The decision rule is refreshingly mechanical. If the p-value is less than or equal to alpha, you reject H0. If the p-value is greater than alpha, you fail to reject H0. In our coffee example the p-value of 0.036 was below 0.05, so we rejected. Had the p-value been 0.20, we would have failed to reject and concluded there was not enough evidence.
Common trap: "Fail to reject H0" is not the same as "H0 is true." A large p-value only means you lack strong evidence against the null, perhaps because your sample was too small. Never write that you have "proven" the null hypothesis, because that phrasing costs marks.
Another point worth internalizing is that the p-value does not tell you how big or important an effect is. A tiny, meaningless difference can be statistically significant if your sample is huge, and a large, meaningful difference can be non-significant if your sample is tiny. Good assignments mention this distinction between statistical significance and practical significance, and doing so often earns bonus credit.

Type I and Type II Errors Explained Simply
Every hypothesis test carries a risk of being wrong, and your assignment may ask you to name those risks. There are two ways a decision can go astray, and keeping them straight is a common exam question.
- Type I error: rejecting a null hypothesis that is actually true. This is a false alarm, and its probability equals alpha, the significance level you chose.
- Type II error: failing to reject a null hypothesis that is actually false. This is a missed detection, and its probability is labeled beta.
The two errors trade off against each other. Lowering alpha to reduce false alarms makes you more likely to miss a real effect, raising beta. The power of a test, calculated as one minus beta, is its ability to detect a true effect. Larger samples increase power, which is why researchers care so much about sample size. If your assignment asks you to comment on error types, connecting them back to sample size shows genuine understanding.
Confidence Intervals: The Other Side of the Coin
Many assignments pair hypothesis testing with confidence intervals, and the two are deeply connected. A confidence interval gives a range of plausible values for the population parameter based on your sample. A 95 percent confidence interval, for instance, is built so that this method captures the true value 95 percent of the time across repeated samples.
Here is the useful link: for a two-tailed test, if the claimed value falls outside the confidence interval, you reject the null hypothesis, and if it falls inside, you fail to reject. In our coffee example, a 95 percent confidence interval for the mean would not contain 350, which matches our decision to reject. Showing this consistency in your write-up demonstrates a strong grasp of the material and often impresses graders.
Common Mistakes That Cost Marks
After seeing many statistics assignments, the same errors appear again and again. Avoiding this short list will lift your grade more than any single calculation trick.
Wrong tail direction
Running a one-tailed test when the question implies "different" (two-tailed), or vice versa. Read the wording carefully for words like "higher," "lower," or "changed."
Mixing up z and t
Using a z-test with a small sample and unknown population standard deviation. When the SD comes from your sample, the t-distribution is almost always correct.
Vague conclusions
Writing "reject H0" with no context. Always translate the result back into the language of the original problem to earn full communication marks.
Claiming proof
Saying the null is "proven" or "true." Hypothesis tests provide evidence, never certainty, so keep your wording tentative and precise.
One more subtle mistake is forgetting to check the assumptions behind a test. A t-test assumes roughly normal data or a large enough sample, and independence between observations. Many rubrics award a mark or two simply for stating that these assumptions are reasonable given the scenario, so never skip that sentence.
A Quick Template You Can Reuse
To make your next hypothesis testing assignment faster, keep a reusable structure and fill in the blanks each time. This template mirrors what most instructors expect and keeps your work organized and easy to grade.
- State H0 and H1 in symbols and words, and note one-tailed or two-tailed.
- Write down alpha and the test you are using, with a one-line reason.
- Show the test statistic formula, then substitute your numbers clearly.
- Report degrees of freedom, the critical value or p-value, and the comparison.
- State your decision, then write a context-specific conclusion sentence.
- Add a brief note on assumptions and, if asked, error types or a confidence interval.
With this scaffold, even an unfamiliar problem becomes manageable, because you always know what comes next. The hardest part of any statistics assignment is starting, and a fixed template removes that friction entirely.
Frequently Asked Questions
What is the first step in a hypothesis testing assignment?
The first step is always stating the null hypothesis (H0) and the alternative hypothesis (H1) in both symbols and plain words, and deciding whether the test is one-tailed or two-tailed. Doing this before any calculation prevents the most common errors and sets the direction for everything that follows.
How do I know whether to use a z-test or a t-test?
Use a z-test when the population standard deviation is known or the sample is very large. Use a t-test when you only have the sample standard deviation and a smaller sample, which is the more common situation in coursework. When in doubt with real assignment data, the t-test is usually the safer choice.
What does the p-value actually mean?
The p-value is the probability of observing a sample result as extreme as yours, or more extreme, if the null hypothesis were true. A small p-value (at or below your alpha) is evidence against the null, so you reject it. A large p-value means you lack strong evidence, so you fail to reject.
Can EasyAssignments help with my hypothesis testing assignment?
Yes. Our tutors can check your setup, verify your calculations, and help you write clear, correctly worded conclusions. Whether you are working with a t-test, chi-square, or ANOVA, you can request a free quote or talk to support to get guidance tailored to your specific problem.
Turn Your Next Hypothesis Test Into an Easy Win
You now have the framework, a solved example, and a reusable template. If you would rather have an expert double-check your work or handle a tricky dataset, EasyAssignments is ready to help.