
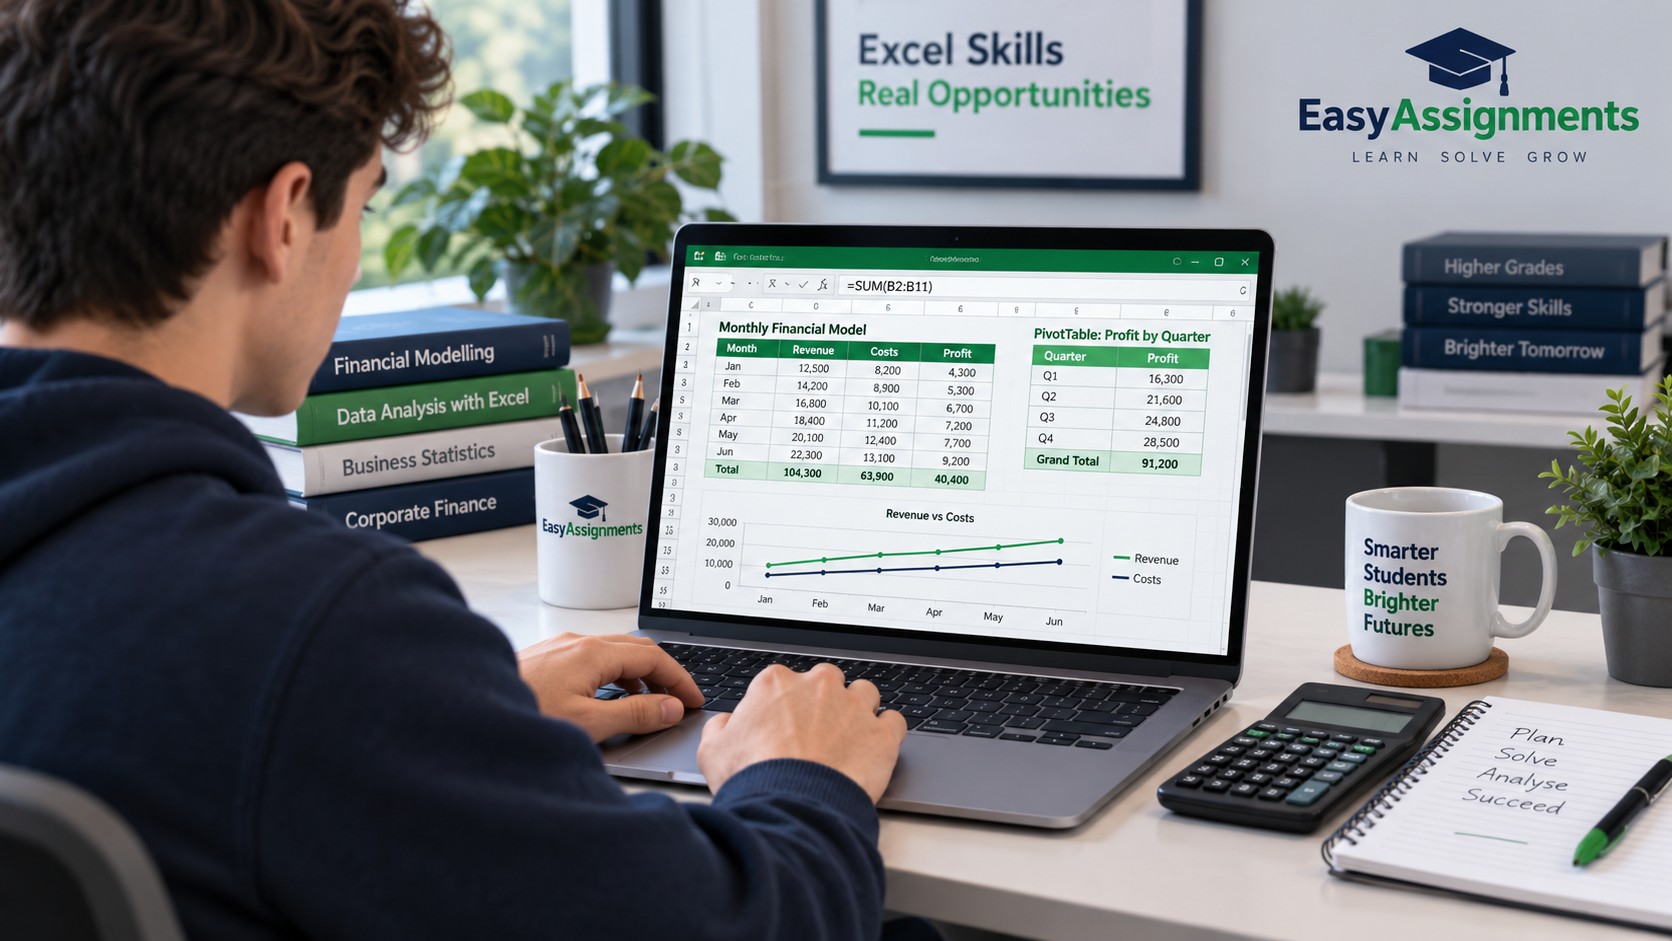
Excel Assignment Help: Formulas, Pivot Tables & Financial Models
Excel assignment help from EasyAssignments supports students who need clear, working spreadsheets, whether the task is a set of nested formulas, a pivot table report, or a full financial model with scenarios and charts.
This guide walks through the Excel skills most courses test, the errors that quietly cost marks, and how to structure a workbook your instructor can follow from the first input cell to the final output.
What Excel Assignment Help Really Covers
Excel assignment help is about more than typing numbers into cells. Most spreadsheet tasks in business, accounting, finance, economics, engineering, and statistics courses test whether you can turn a messy question into a logical, repeatable calculation. Instructors look at the answer, but they also look at how you reached it: which functions you chose, whether your references are correct, and whether someone else could open your file and understand it.
That is why so many students find Excel coursework harder than expected. You might understand the finance or statistics concept perfectly well in a lecture, then lose an evening fighting a #N/A error or a pivot table that will not group dates. The software rewards precision, and small structural mistakes spread quickly across a workbook.
Typical Excel assignments fall into a few broad groups:
- Formula exercises: building calculations with logical tests, lookups, text handling, and date arithmetic.
- Data analysis tasks: cleaning a dataset, summarizing it with pivot tables, and presenting findings with charts.
- Financial modeling projects: loan schedules, budgets, forecasts, NPV and IRR analysis, and three-statement models.
- Statistical work: descriptive statistics, regression, and hypothesis tests using built-in functions or the Analysis ToolPak.
- Dashboards and reports: combining pivots, charts, and slicers into a single view for decision makers.
Key idea: A strong Excel submission is transparent. Every number should trace back to an input or a formula, with no hardcoded values hidden inside calculations. Marking schemes frequently reward this structure as much as the final result.
Core Excel Formulas Every Assignment Uses
Nearly every spreadsheet task starts with formulas. Knowing which function fits which job, and how to combine them, is the foundation of any good Excel assignment. The groups below cover the functions that appear again and again in coursework.
Math and statistical functions
SUM, AVERAGE, MIN, MAX, and COUNT are the obvious starting points, but assignments usually push further. SUMIF and SUMIFS add values that meet one or more conditions, such as total sales for a region in a given month. COUNTIFS and AVERAGEIFS work the same way for counts and averages. For statistics units, expect MEDIAN, STDEV.S, STDEV.P, VAR.S, CORREL, and PERCENTILE, along with ROUND, ROUNDUP, and ROUNDDOWN for presenting results cleanly.
A common trap is choosing between sample and population functions. STDEV.S estimates the standard deviation of a population from a sample, while STDEV.P treats your data as the entire population. Your assignment brief usually tells you which applies, and using the wrong one changes the answer.
Logical functions: IF, IFS, AND, OR
The IF function tests a condition and returns one value if it is true and another if it is false. Assignments often ask you to classify data, for example labeling students as Pass or Fail, or flagging invoices as overdue. When there are several outcomes, you can nest IF statements, but IFS (available in newer versions of Excel) is easier to read because it lists each condition and result in order.
AND and OR let you combine tests inside an IF. A formula such as =IF(AND(B2>=50, C2="Submitted"), "Pass", "Review") checks two conditions at once. IFERROR is another essential function: it catches errors and replaces them with a value you choose, such as zero or a blank. Use it carefully, though, because hiding every error can also hide genuine mistakes.
Lookup functions: VLOOKUP, INDEX and MATCH, XLOOKUP
Lookup functions pull related information from another table, such as a product price from a price list or a grade from a grade boundary table. They are among the most tested skills in Excel coursework and among the most common sources of errors.
VLOOKUP searches the first column of a range and returns a value from a column to the right. It is widely taught but has limits: it cannot look to the left, and inserting a column can break it if the column number is hardcoded. INDEX combined with MATCH is more flexible, because MATCH finds the position of a value and INDEX returns whatever sits at that position in any column. XLOOKUP, available in Microsoft 365 and Excel 2021 and later, combines the strengths of both in one function, with exact match as its default and a built-in option for a value to return when nothing is found.
| Function | Looks left? | Default match type | Best used when |
|---|---|---|---|
| VLOOKUP | No | Approximate (unless FALSE is set) | Your course requires it or the lookup column is on the far left |
| HLOOKUP | Not applicable (searches rows) | Approximate (unless FALSE is set) | Data is laid out horizontally across rows |
| INDEX + MATCH | Yes | Set by MATCH (0 for exact) | You need flexibility or work in an older Excel version |
| XLOOKUP | Yes | Exact | You use Microsoft 365 or Excel 2021 and want cleaner formulas |
One detail catches many students: VLOOKUP defaults to approximate match. If you leave out the final argument, Excel may return a value from the wrong row without any error message. For exact lookups, always set the last argument to FALSE or 0.
Text and date functions
Real datasets are rarely clean. TRIM removes extra spaces that cause lookups to fail, while LEFT, RIGHT, MID, and LEN extract parts of codes or names. TEXTJOIN and CONCAT combine text from several cells. UPPER, LOWER, and PROPER standardize capitalization.
Dates are stored as serial numbers, which is what allows arithmetic like subtracting one date from another. TODAY, EOMONTH, EDATE, DATEDIF, NETWORKDAYS, and YEARFRAC appear frequently in finance and HR assignments, for example when calculating employee tenure, loan maturity dates, or the number of working days in a project.
Relative and absolute references
When you copy a formula, Excel adjusts the cell references automatically. That is a relative reference, and it is usually what you want. Sometimes, though, a reference must stay fixed, such as a tax rate or an interest rate stored in a single input cell. Adding dollar signs, as in $B$1, makes it absolute. Pressing F4 while editing a reference cycles through the options, including mixed references like $B1 or B$1, which are useful when building two-way tables.
Getting references wrong is one of the most frequent reasons an Excel assignment produces results that look plausible in the first row and fall apart further down. Checking a few copied cells with the formula bar, or using Show Formulas on the Formulas tab, catches most of these problems.
Dynamic array functions
If your course uses Microsoft 365, you may also meet dynamic array functions such as FILTER, SORT, UNIQUE, and SEQUENCE. A single formula can return a whole list that spills into neighboring cells, which makes tasks like extracting unique customers or filtering records by criteria much simpler than older methods.
Pivot Tables: Turning Raw Data into Insight
Pivot tables let you summarize thousands of rows in seconds, grouping data by category, date, or region and calculating totals, averages, or counts. They are central to data analysis assignments and business analytics modules, and they are one of the skills employers look for most often in spreadsheet users.
Preparing your data first
Most pivot table problems start with the source data. Before you build anything, check that:
- Every column has a single, clear header, with no merged cells above the data.
- There are no completely blank rows or columns splitting the dataset.
- Each column holds one type of data, so numbers are not stored as text and dates are real dates.
- The data is in a long, tidy format, with one record per row rather than monthly figures spread across many columns.
Converting the range into an Excel Table (Ctrl+T) is a smart habit. Tables expand automatically when you add rows, so the pivot table picks up new data when you refresh instead of relying on a fixed range.
Building the pivot table
Select any cell in your data, then choose Insert > PivotTable and place it on a new worksheet. The PivotTable Fields pane has four areas. Rows and Columns define how data is grouped, Values holds the numbers being summarized, and Filters limits what is shown. Dragging Region to Rows, Month to Columns, and Sales to Values gives an instant cross-tabulation of sales by region and month.
Dates can be grouped by months, quarters, or years by right-clicking a date field and choosing Group. Numeric fields such as ages or order sizes can be grouped into bands in the same way, which is useful for frequency analysis.
Value field settings and calculated fields
By default, numeric fields are summed. Through Value Field Settings you can switch to Count, Average, Max, Min, and more. The Show Values As tab adds options like % of Grand Total, % of Column Total, Running Total, and Difference From, which answer many typical assignment questions, such as what share of revenue each product contributes.
Calculated fields let you create new measures inside the pivot, for example profit as revenue minus cost, or margin as profit divided by revenue. Be aware that calculated fields work on the summed values, not row by row, so ratios behave correctly while some other calculations may need to be done in the source data instead.
Slicers, timelines, and pivot charts
Slicers add clickable filter buttons, and timelines provide a sliding date filter. Connected to several pivot tables, they turn a workbook into an interactive dashboard. Pivot charts sit on top of a pivot table and update whenever the pivot changes, which makes them ideal for presentation-style assignments where you need to show trends clearly.
Watch out: Pivot tables do not update automatically when source data changes. After editing your data, right-click the pivot and choose Refresh, or use Refresh All on the Data tab. Submitting a report with stale figures is an easy way to lose marks.
Stuck on a Formula or Pivot Table?
Share your brief and dataset with EasyAssignments and get a clear, working Excel file with explanations you can learn from.
Financial Models in Excel Assignments
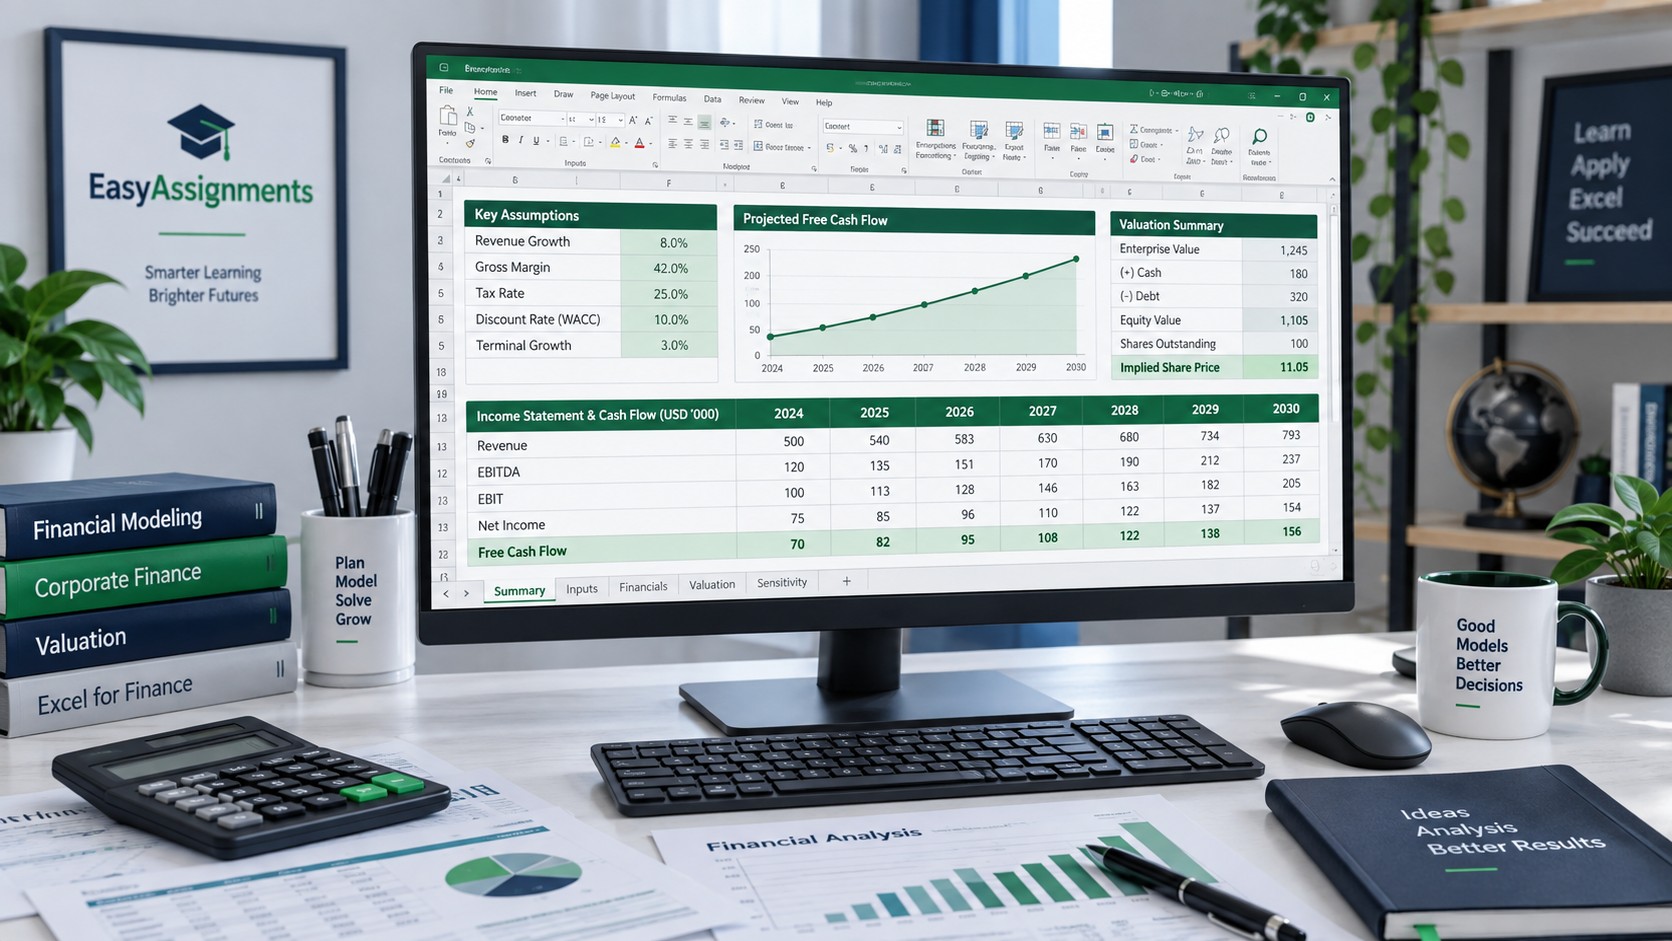
Financial modeling assignments bring formulas, structure, and finance theory together. Whether you are building a loan amortization schedule, a project appraisal, or a company valuation, the same principles apply: separate inputs from calculations, keep formulas consistent, and make the logic easy to audit.
Structure: inputs, calculations, outputs
A well-built model usually has three layers. The inputs section holds assumptions such as growth rates, interest rates, tax rates, and initial investment, ideally formatted in a distinct color so they are easy to spot. The calculations section references those inputs and never contains typed-in numbers. The outputs section summarizes results like NPV, IRR, payback period, or key ratios, often with charts.
Many finance courses follow common conventions, such as blue font for hardcoded inputs and black font for formulas. Even if your brief does not require them, these habits make your work look professional and help markers follow it. Consistent formulas across a row, where every column uses the same logic, also reduce errors and make checking faster.
Time value of money functions
Excel includes a family of functions built for finance assignments:
- PMT: the regular payment on a loan, given the rate per period, number of periods, and present value.
- IPMT and PPMT: split each payment into interest and principal, which is exactly what an amortization schedule needs.
- PV and FV: the present and future value of a series of cash flows or a lump sum.
- RATE and NPER: solve for the interest rate or number of periods.
- NPV and IRR: evaluate investment projects using periodic cash flows.
- XNPV and XIRR: the same idea when cash flows occur on irregular dates.
Two details trip students up regularly. First, rates and periods must match: a monthly loan needs the annual rate divided by 12 and the number of years multiplied by 12. Second, the NPV function treats the first value in its range as arriving at the end of period one. If your initial investment happens today, at period zero, leave it out of the NPV range and add it separately, as in =NPV(rate, C5:G5) + B5. Sign conventions matter too: Excel returns payments as negative numbers when the loan amount is positive, reflecting cash flowing out.
Three-statement models
More advanced courses ask for linked income statements, balance sheets, and cash flow statements. Net income flows from the income statement into retained earnings and the cash flow statement. Changes in working capital, depreciation, capital expenditure, and financing activities connect the statements, and the ending cash balance from the cash flow statement feeds the balance sheet.
The classic test of a three-statement model is whether the balance sheet balances in every period. Adding a check row that subtracts total liabilities and equity from total assets, and should equal zero, is good practice. When it does not balance, the cause is usually a missing link, a sign error, or an item counted twice.
Sensitivity and scenario analysis
Instructors often want to see how results change when assumptions change. Excel offers three What-If Analysis tools on the Data tab:
- Goal Seek: finds the input value needed to reach a target, such as the sales volume required to break even.
- Data Tables: show an output across a range of one or two inputs, for example NPV at different discount rates and growth rates.
- Scenario Manager: stores named sets of assumptions, such as base, best, and worst cases, and produces a summary report.
For larger optimization problems, the Solver add-in can maximize or minimize an output subject to constraints, which is common in operations and management science assignments.
Circular references and interest calculations
Some models create circular references, for example when interest expense depends on average debt, which depends on cash flow, which depends on interest. Excel warns about these by default. Some courses allow iterative calculation to resolve them, while others prefer calculating interest on opening balances to avoid the loop. Check your brief, and if you do enable iteration, explain why in your notes.
Common Excel Assignment Mistakes and How to Fix Them
Errors are part of working in Excel, but knowing what each one means makes them far quicker to fix. These are the ones students see most:
- #N/A: a lookup could not find the value. Check for extra spaces, numbers stored as text, or the wrong match type.
- #DIV/0!: a formula is dividing by zero or an empty cell. Fix the input, or handle it with IF or IFERROR where appropriate.
- #REF!: a referenced cell was deleted. Undo the deletion or rebuild the reference.
- #VALUE!: a formula is using the wrong data type, often text where a number is expected.
- #NAME?: Excel does not recognize a function or range name, usually because of a typo or a function unavailable in your version.
- Hardcoded numbers: typing a value into a formula instead of referencing an input cell makes the model inflexible and is often penalized.
- Inconsistent formulas: a single different formula in a row of otherwise identical ones is hard to spot and easy to mark down.
The Formula Auditing tools on the Formulas tab, including Trace Precedents, Trace Dependents, and Evaluate Formula, let you step through a calculation and see exactly where it goes wrong. They are worth learning early because they save hours later.
How EasyAssignments Excel Assignment Help Works
When you use EasyAssignments for Excel assignment help, the goal is a workbook that answers the brief and that you can understand, explain, and build on. Support is shaped around your instructions, your dataset, and the version of Excel your course uses.
Formula Support
Help with logical, lookup, statistical, text, and date formulas, including fixing errors in workbooks you have already started.
Pivot Table Analysis
Data cleaning, pivot tables, calculated fields, slicers, and pivot charts that turn raw data into clear findings.
Financial Modeling
Loan schedules, budgets, forecasts, NPV and IRR appraisals, three-statement models, and sensitivity analysis.
Clear Documentation
Labeled inputs, consistent formulas, and notes that explain the method so you can follow every step.
The process is simple. You share the assignment brief, any data files, marking criteria, and your deadline. The requirements are reviewed, you receive a quote, and the work is completed to the specified structure. You then get a working .xlsx file, not a screenshot, so you can inspect each formula and see how the results were produced.
Tips to Improve Your Excel Assignment Grades
Whether you work alone or with support, these habits make Excel submissions stronger:
- Read the brief twice. Note required functions, chart types, file formats, and whether specific tools such as the Analysis ToolPak are expected.
- Plan the layout before typing. Sketch where inputs, workings, and outputs will go, and use separate sheets for each if the model is large.
- Label everything. Clear headers, units, and sheet names help markers follow your work.
- Use named ranges for key inputs. A formula like =Revenue*TaxRate is easier to read than one full of cell addresses.
- Test with simple numbers. Plug in easy values you can check by hand to confirm formulas behave correctly.
- Format for readability. Apply consistent number formats, avoid excessive colors, and keep charts titled and labeled.
- Check compatibility. If your instructor uses an older Excel version, avoid functions like XLOOKUP or FILTER unless they are allowed.
- Save versions as you go. Keeping dated copies protects you from accidental overwrites and corrupted files.
Finally, use any help you receive as a learning resource. Walking through a finished workbook formula by formula is one of the fastest ways to build the confidence you need for timed Excel exams, which usually do not allow outside support. Always follow your institution's academic integrity policy on how guidance can be used.
Excel Assignment Help: Frequently Asked Questions
What types of tasks does Excel assignment help cover?
Excel assignment help covers formula exercises, lookup and logical functions, data cleaning, pivot tables and pivot charts, statistical analysis, dashboards, and financial models such as loan schedules, budgets, NPV and IRR appraisals, and three-statement models.
Should I use VLOOKUP or XLOOKUP in my assignment?
Follow your brief first. If it does not specify, XLOOKUP is more flexible and defaults to exact match, but it only works in Microsoft 365 and Excel 2021 or later. For older versions, INDEX with MATCH is a reliable alternative to VLOOKUP.
Why is my pivot table not showing new data?
Pivot tables do not refresh automatically. Right-click the pivot and choose Refresh, and make sure the source range includes the new rows. Converting your data into an Excel Table helps the range expand automatically.
Will I receive a working Excel file I can learn from?
Yes. EasyAssignments delivers a working .xlsx workbook with live formulas, labeled inputs, and clear structure, so you can review each calculation and understand how the results were built.
Get Reliable Excel Assignment Help Today
From nested formulas to pivot dashboards and full financial models, EasyAssignments helps you submit a clean, working workbook that meets your brief.